
The Sober Curious Movement: 49% of Americans Trying to Drink Less Alcohol
While many Americans embrace the idea of going alcohol-free for Dry January, the mindset of cutting back on alcohol is extending well past January 31. Our third annual consumer sentiment survey of over 1,000 people aged 21+ finds nearly one in two (49%) Americans are trying to drink less alcohol in 2025, a 44% increase since 2023.
There are numerous reasons Americans are embracing this alcohol-free or alcohol-light lifestyle. For many, it reflects a broader trend within their generation to prioritize physical and mental health, but for others, finances are driving them to cut back. For beverage manufacturers, this shift in consumer behavior and mindset represents an opportunity to create new alcohol-free products to market.
Table of Contents:
2025 Sober Curious and Alcohol Statistics
Sober Curious and Nonalcoholic Drink FAQs
2023-2024 Sober Curious and Alcohol Statistics
The Influence of Gen Z, Cost, and Cannabis on Nonalcoholic Drink Trends
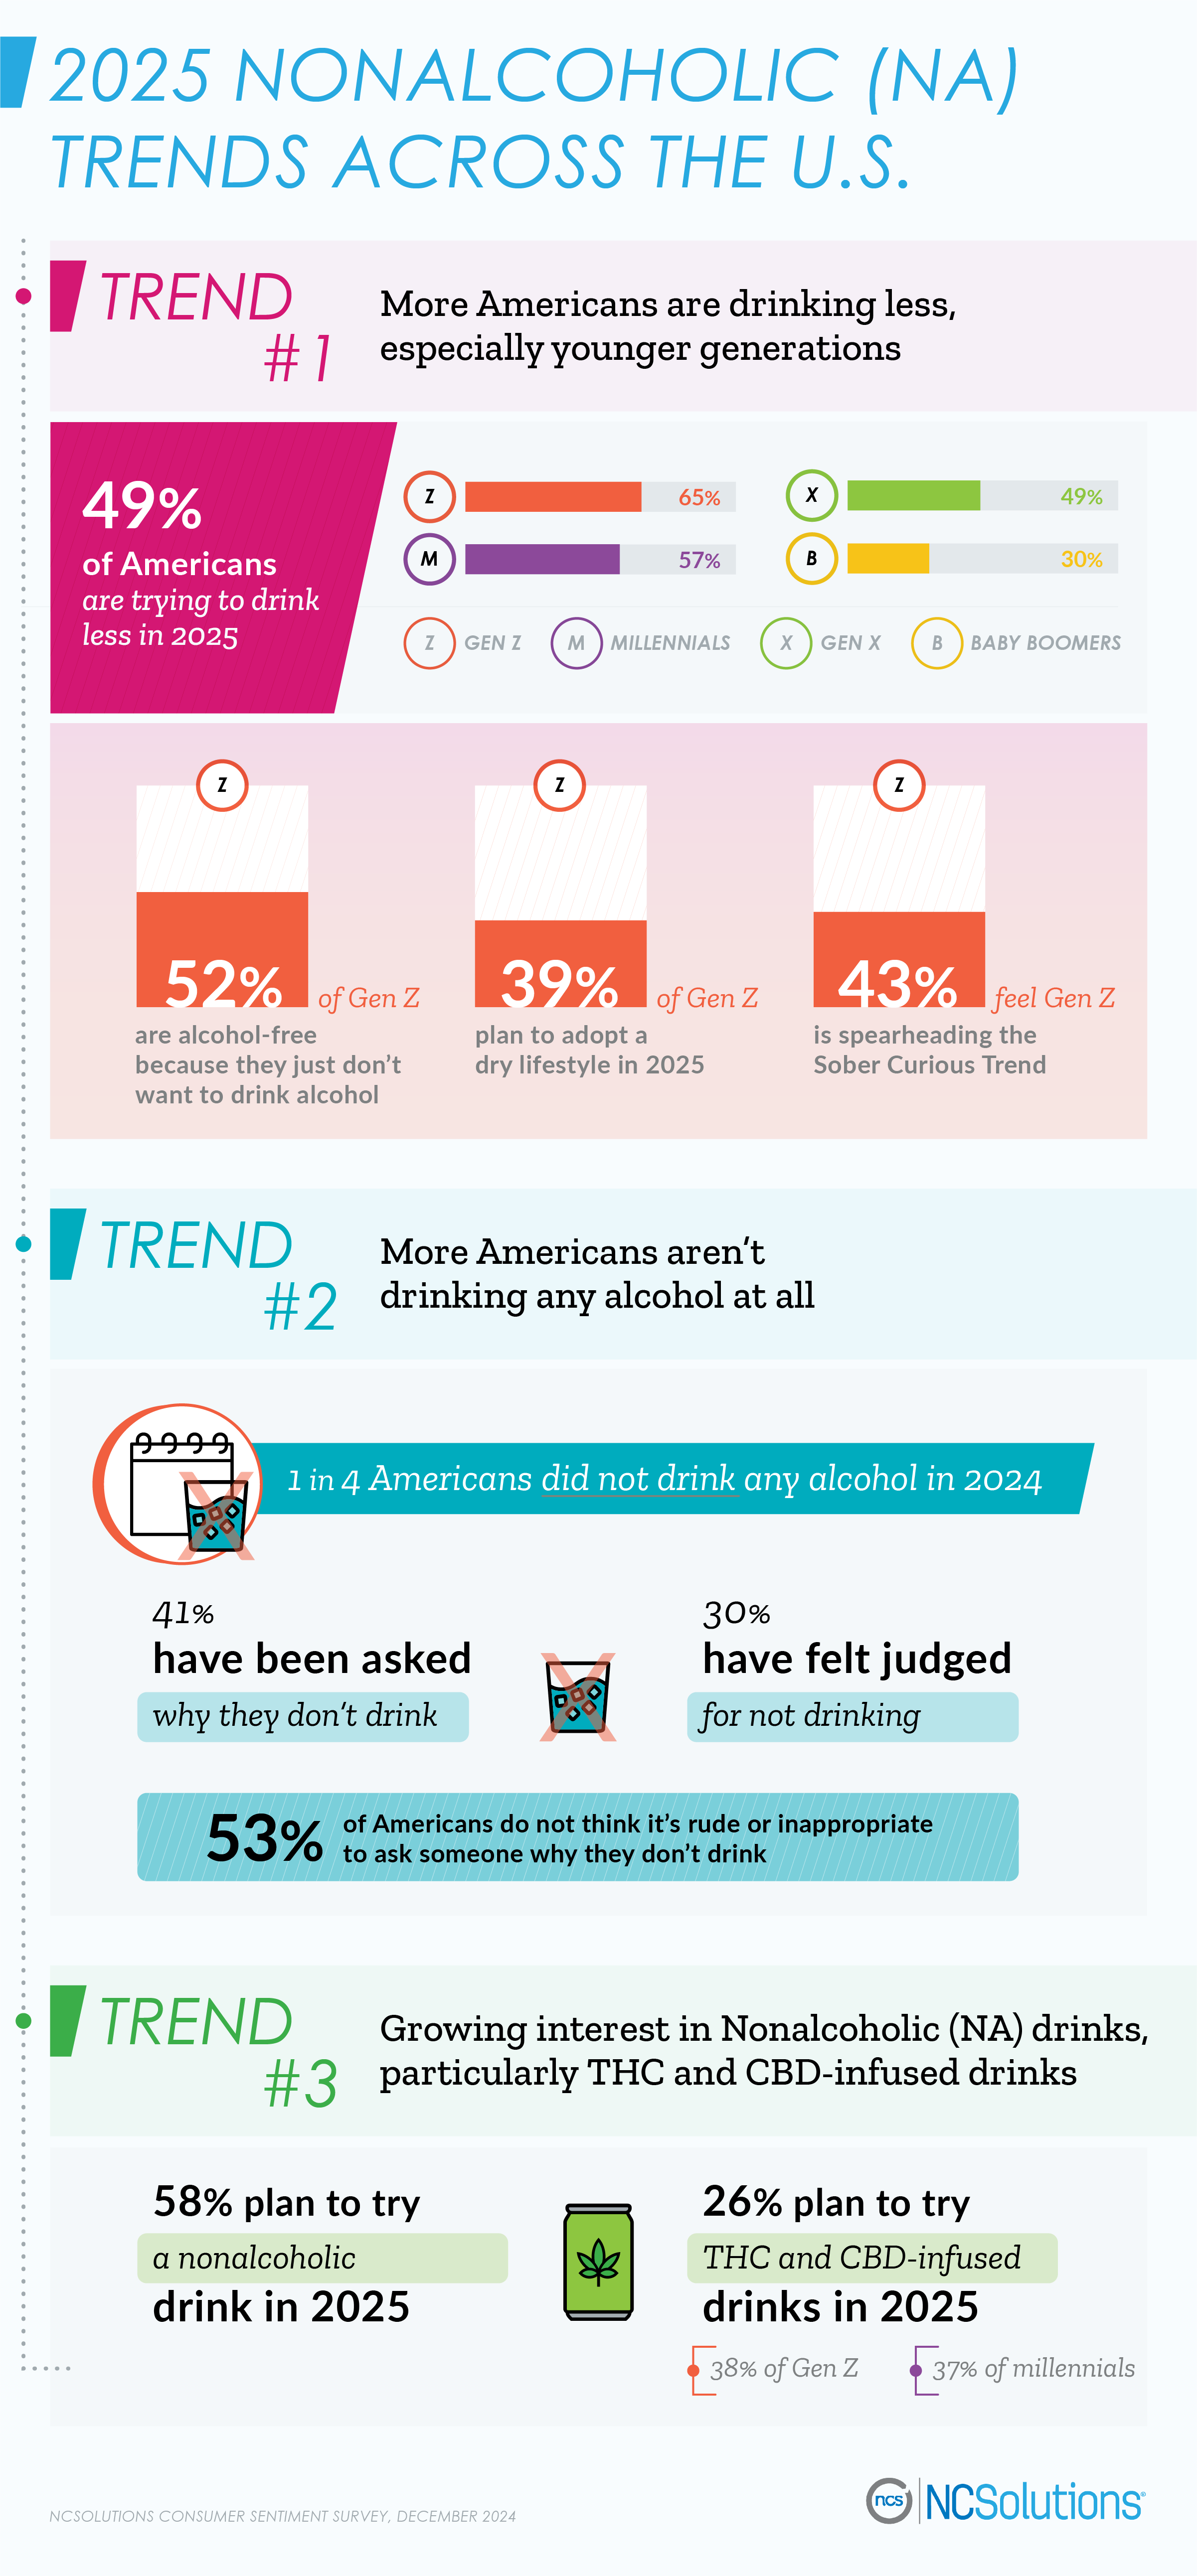
The first month of the year is a popular time for those thinking about cutting back on alcohol to try making the leap into sobriety. Thirty percent of Americans are taking part in Dry January in 2025, a 36% increase from 2024. While many Americans are embracing this sober curious way of living, one generation in particular is leading the charge: Generation Z. Forty-three percent of Americans feel Gen Z is spearheading the sober curious trend, and our research confirms that belief. Nearly two in three (65%) Gen Zers plan to drink less in 2025, and 39% plan to adopt a dry lifestyle not just during January, but during all of 2025.
What Percentage of Americans Don’t Drink
In 2024, 25% of Americans 21 or older did not drink any alcohol at all. Why do people not drink? The main reasons are:
- Just don’t want to
- Don’t like the taste of alcohol
- Improve physical health
- Have addiction concerns
- Improve mental health
While reasons for being alcohol-free vary, 30% of non-drinkers feel judged for not drinking alcohol. Many often navigate social situations where they find themselves being asked why they don’t drink. Over two in five (41%) have been asked that question by others. When we asked if it’s rude to ask people why they don’t drink, Americans were split, with 53% saying it’s not rude or inappropriate.
Currently, 19% of Gen Z don’t drink any alcohol. While many people abstain from alcohol for reasons such as their health, the main reason non-drinking Gen Zers aren’t having any alcohol is because they just don’t want to drink.
With more people cutting back on alcohol, many are turning their attention from cocktails to mocktails and other nonalcoholic (NA) beverages. While 58% plan to try a nonalcoholic drink in 2025, one alcohol-free drink in particular is gaining interest: THC- and CBD-infused drinks. Over one in four Americans plan to try these cannabis-infused drinks. The younger generations are particularly interested in tasting it: 38% of Gen Z and 37% of millennials want to try a NA drink in 2025.
Growing Popularity of Nonalcoholic Drinks Across America
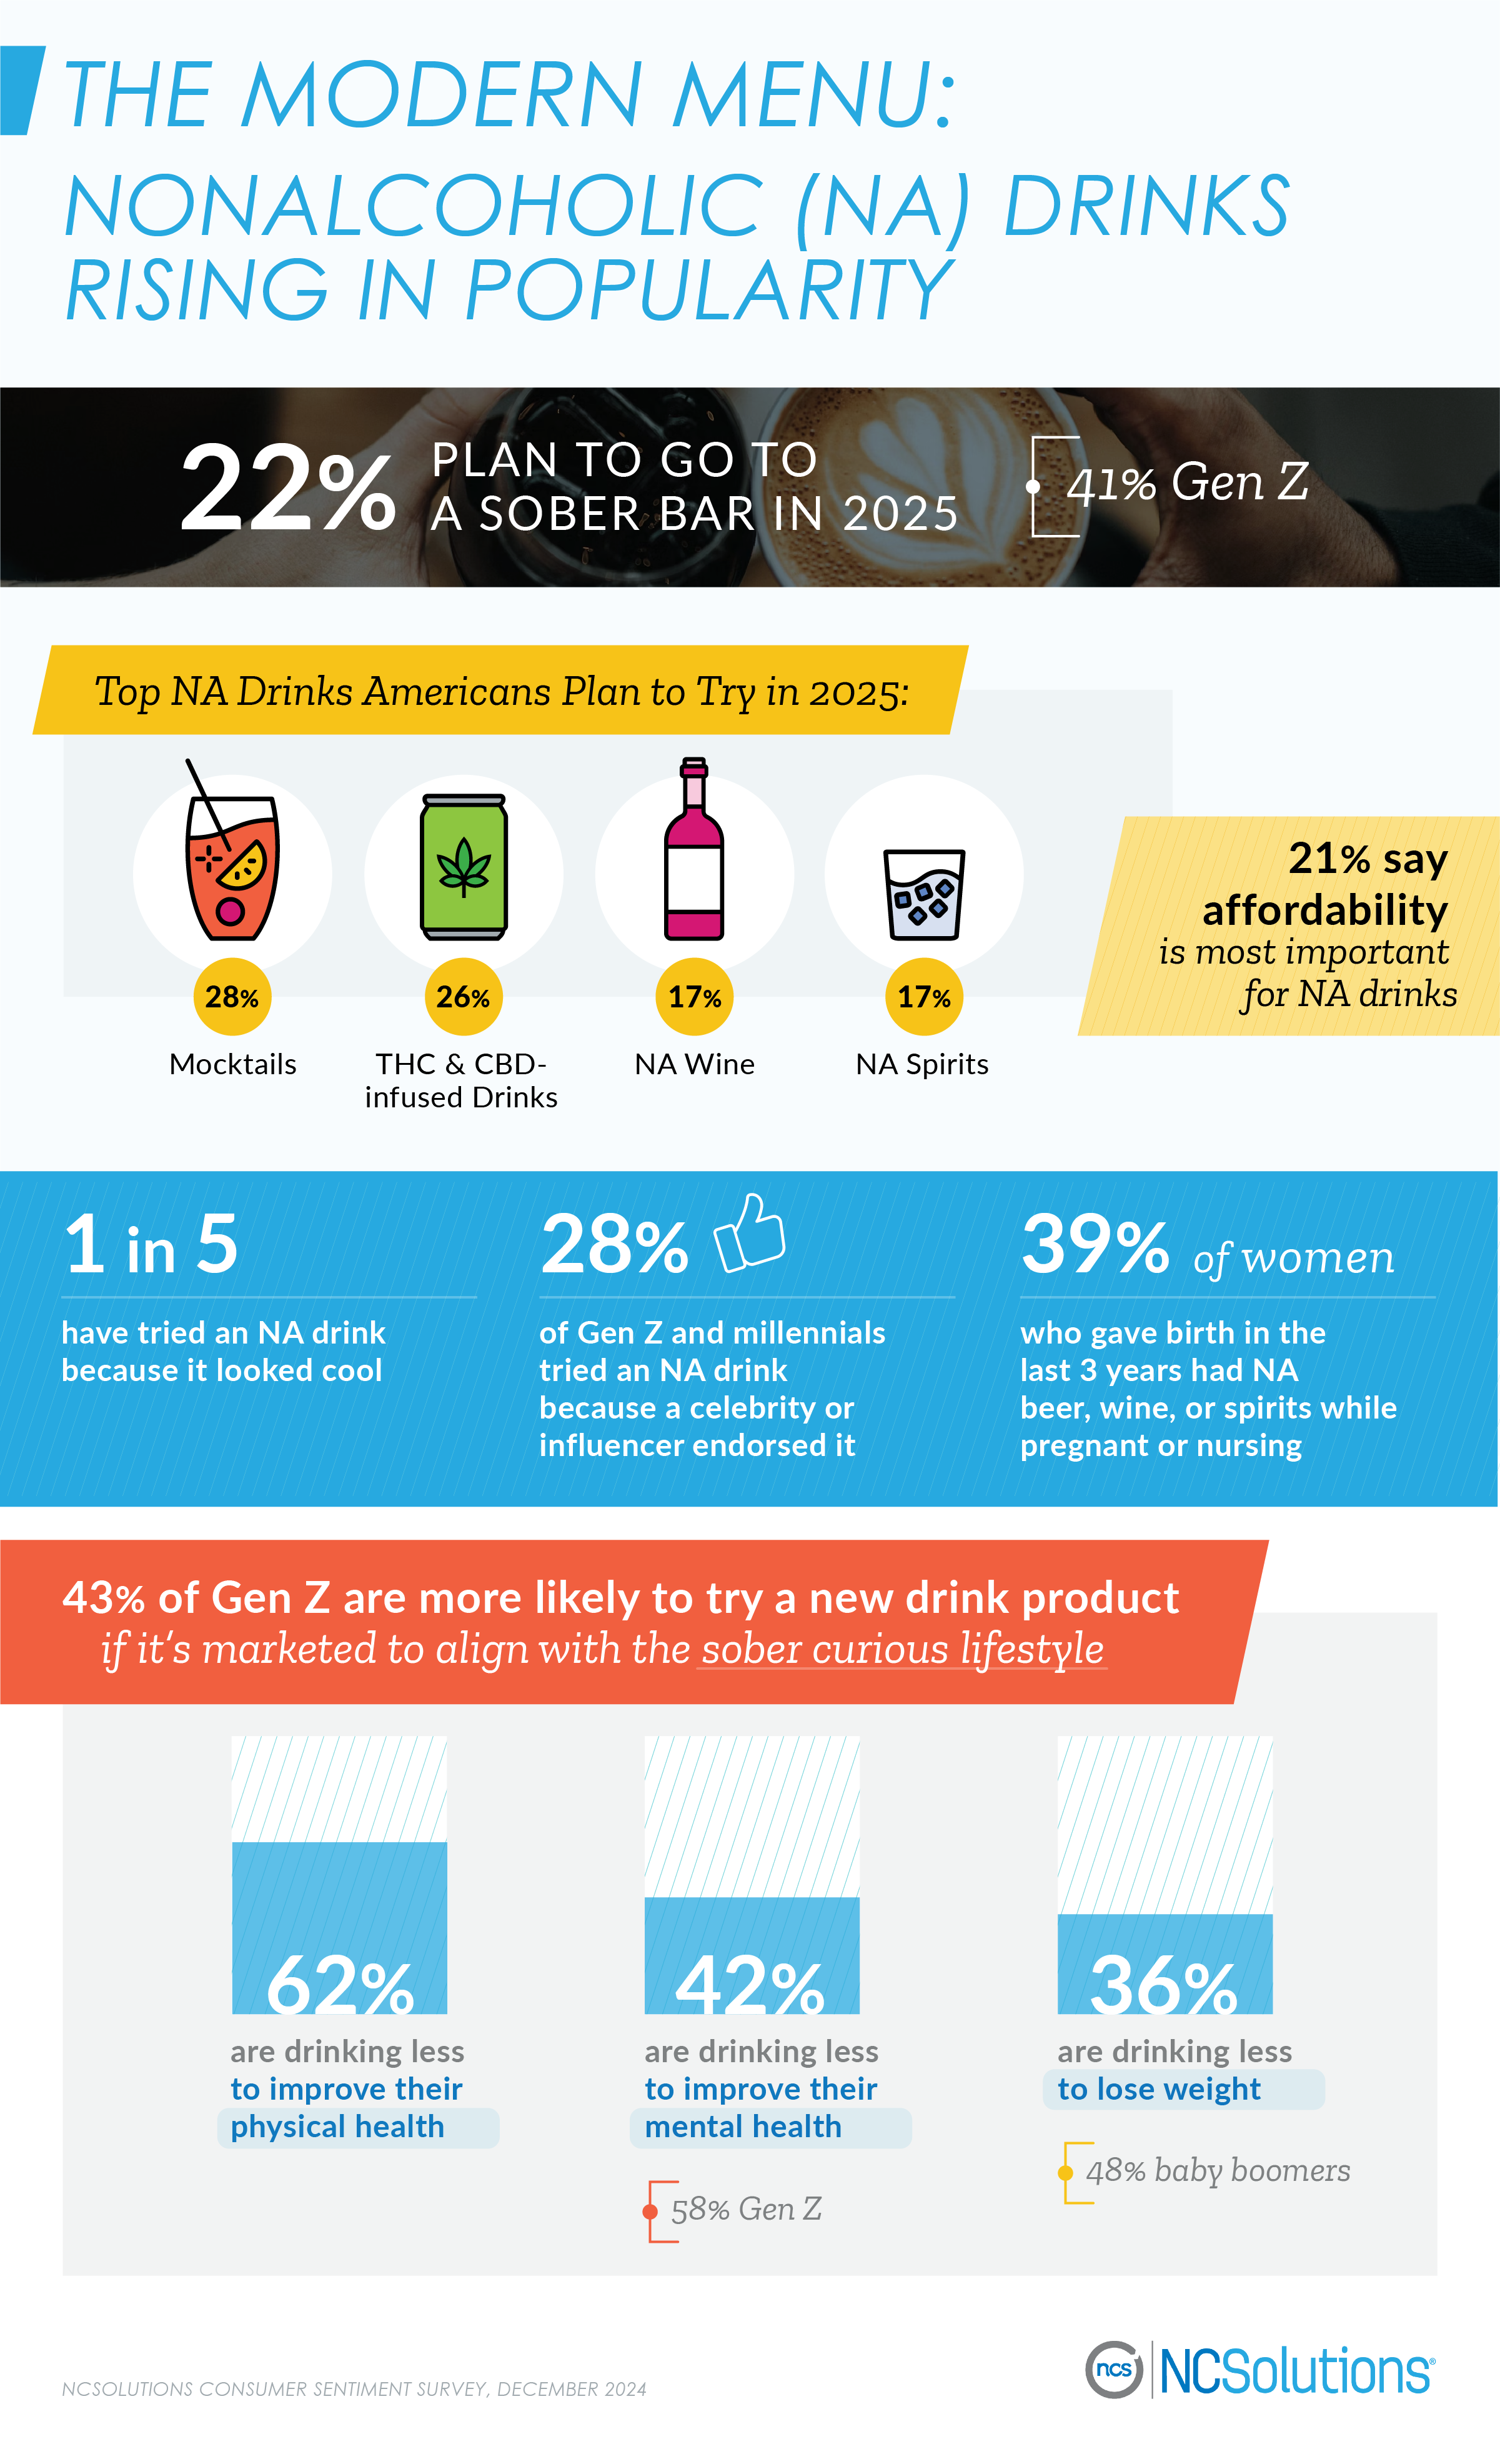
NA drinks are gaining grocery shelf space and are becoming restaurant menu staples instead of specials. While curiosity about the taste is driving many to try NA drinks, the way these drinks look also inspires people to order them. One in five admitted to trying a nonalcoholic drink just because it looked cool. For others, it’s less about the taste and look, but more about fitting in with others. Over one in 10 (13%) have ordered an NA beverage so they’re not the only person at the table without a drink.
These drinks are also becoming increasingly popular among women who are pregnant or breastfeeding. In 2023, 25% of women who gave birth within the last three years had an NA drink while pregnant or nursing. In 2024, that percentage jumped to 39%.
One growing trend: it’s not just what NA drink you get, but where you get it that’s important. In 2025, over one in five (22%) plan to go to a sober bar, which is a space that does not serve any alcoholic drinks. Gen Z are especially interested in sober bars, with 41% planning to go to one.
With increasing interest in this sober curious world, our research is finding that 43% of Gen Z are more likely to try a new drink product if it’s marketed to align with that sober curious lifestyle, reiterating their desire for more purpose-driven advertising. Many younger generations are also hearing about NA drinks online. Over one in four Gen Z and millennials tried an NA drink because a celebrity or influencer endorsed it.
Five Reasons Americans are Drinking Less
The top five reasons Americans are drinking less in 2025 are to:
- Improve their physical health
- Save money
- Make a lifestyle change
- Improve their mental health
- Lose weight
Among Gen Z, there was a significant shift toward cutting back on alcohol to benefit their mental health. Fifty-eight percent say they plan to drink less in 2025 to improve their mental health, a 45% increase from the year prior. Among older Americans, one of the main reasons they’re being more mindful of how much they drink is for their physical health. Nearly half (48%) of baby boomers are drinking less to lose weight compared to 36% of Americans overall.
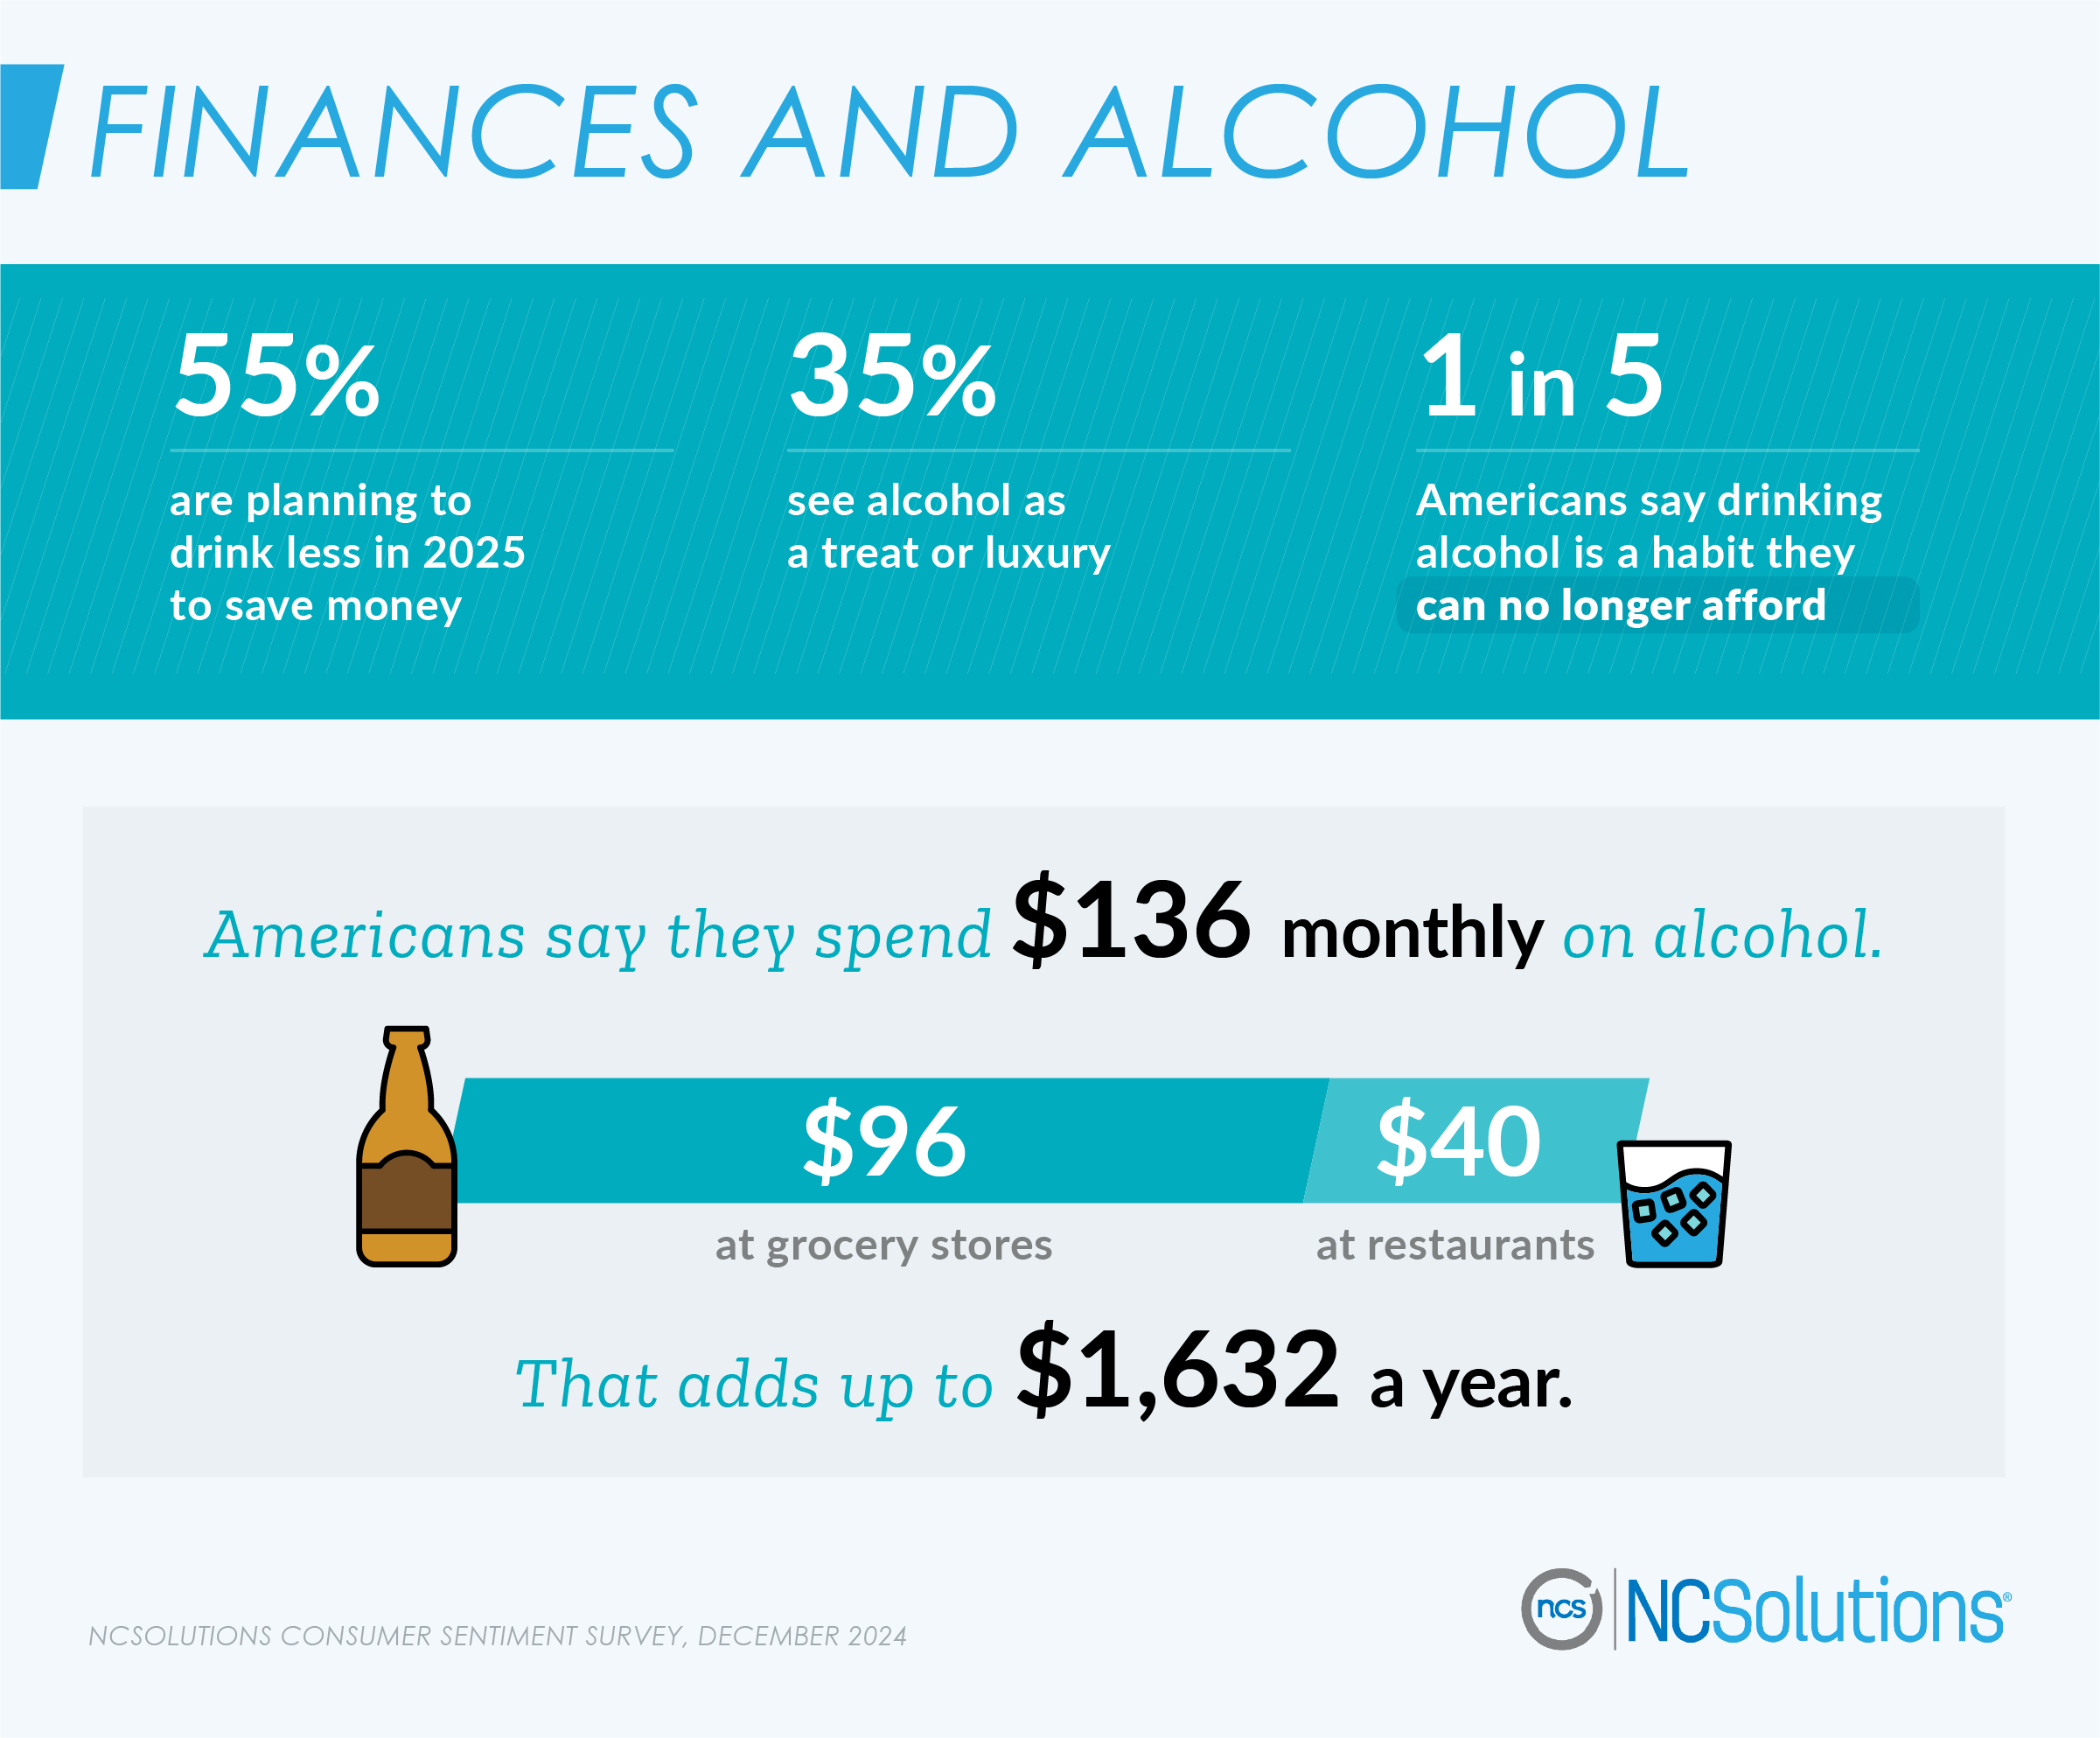
For some Americans, finances are playing a big role in their decision to cut back on alcohol. Over half of Americans are planning to drink less in 2025 to save money, and one in five say drinking alcohol is a habit they can no longer afford. In fact, over one in three are going so far as to say alcohol is a treat or a luxury and not something they see as a regular expense.
Most & Least Popular Months for Alcohol Purchases
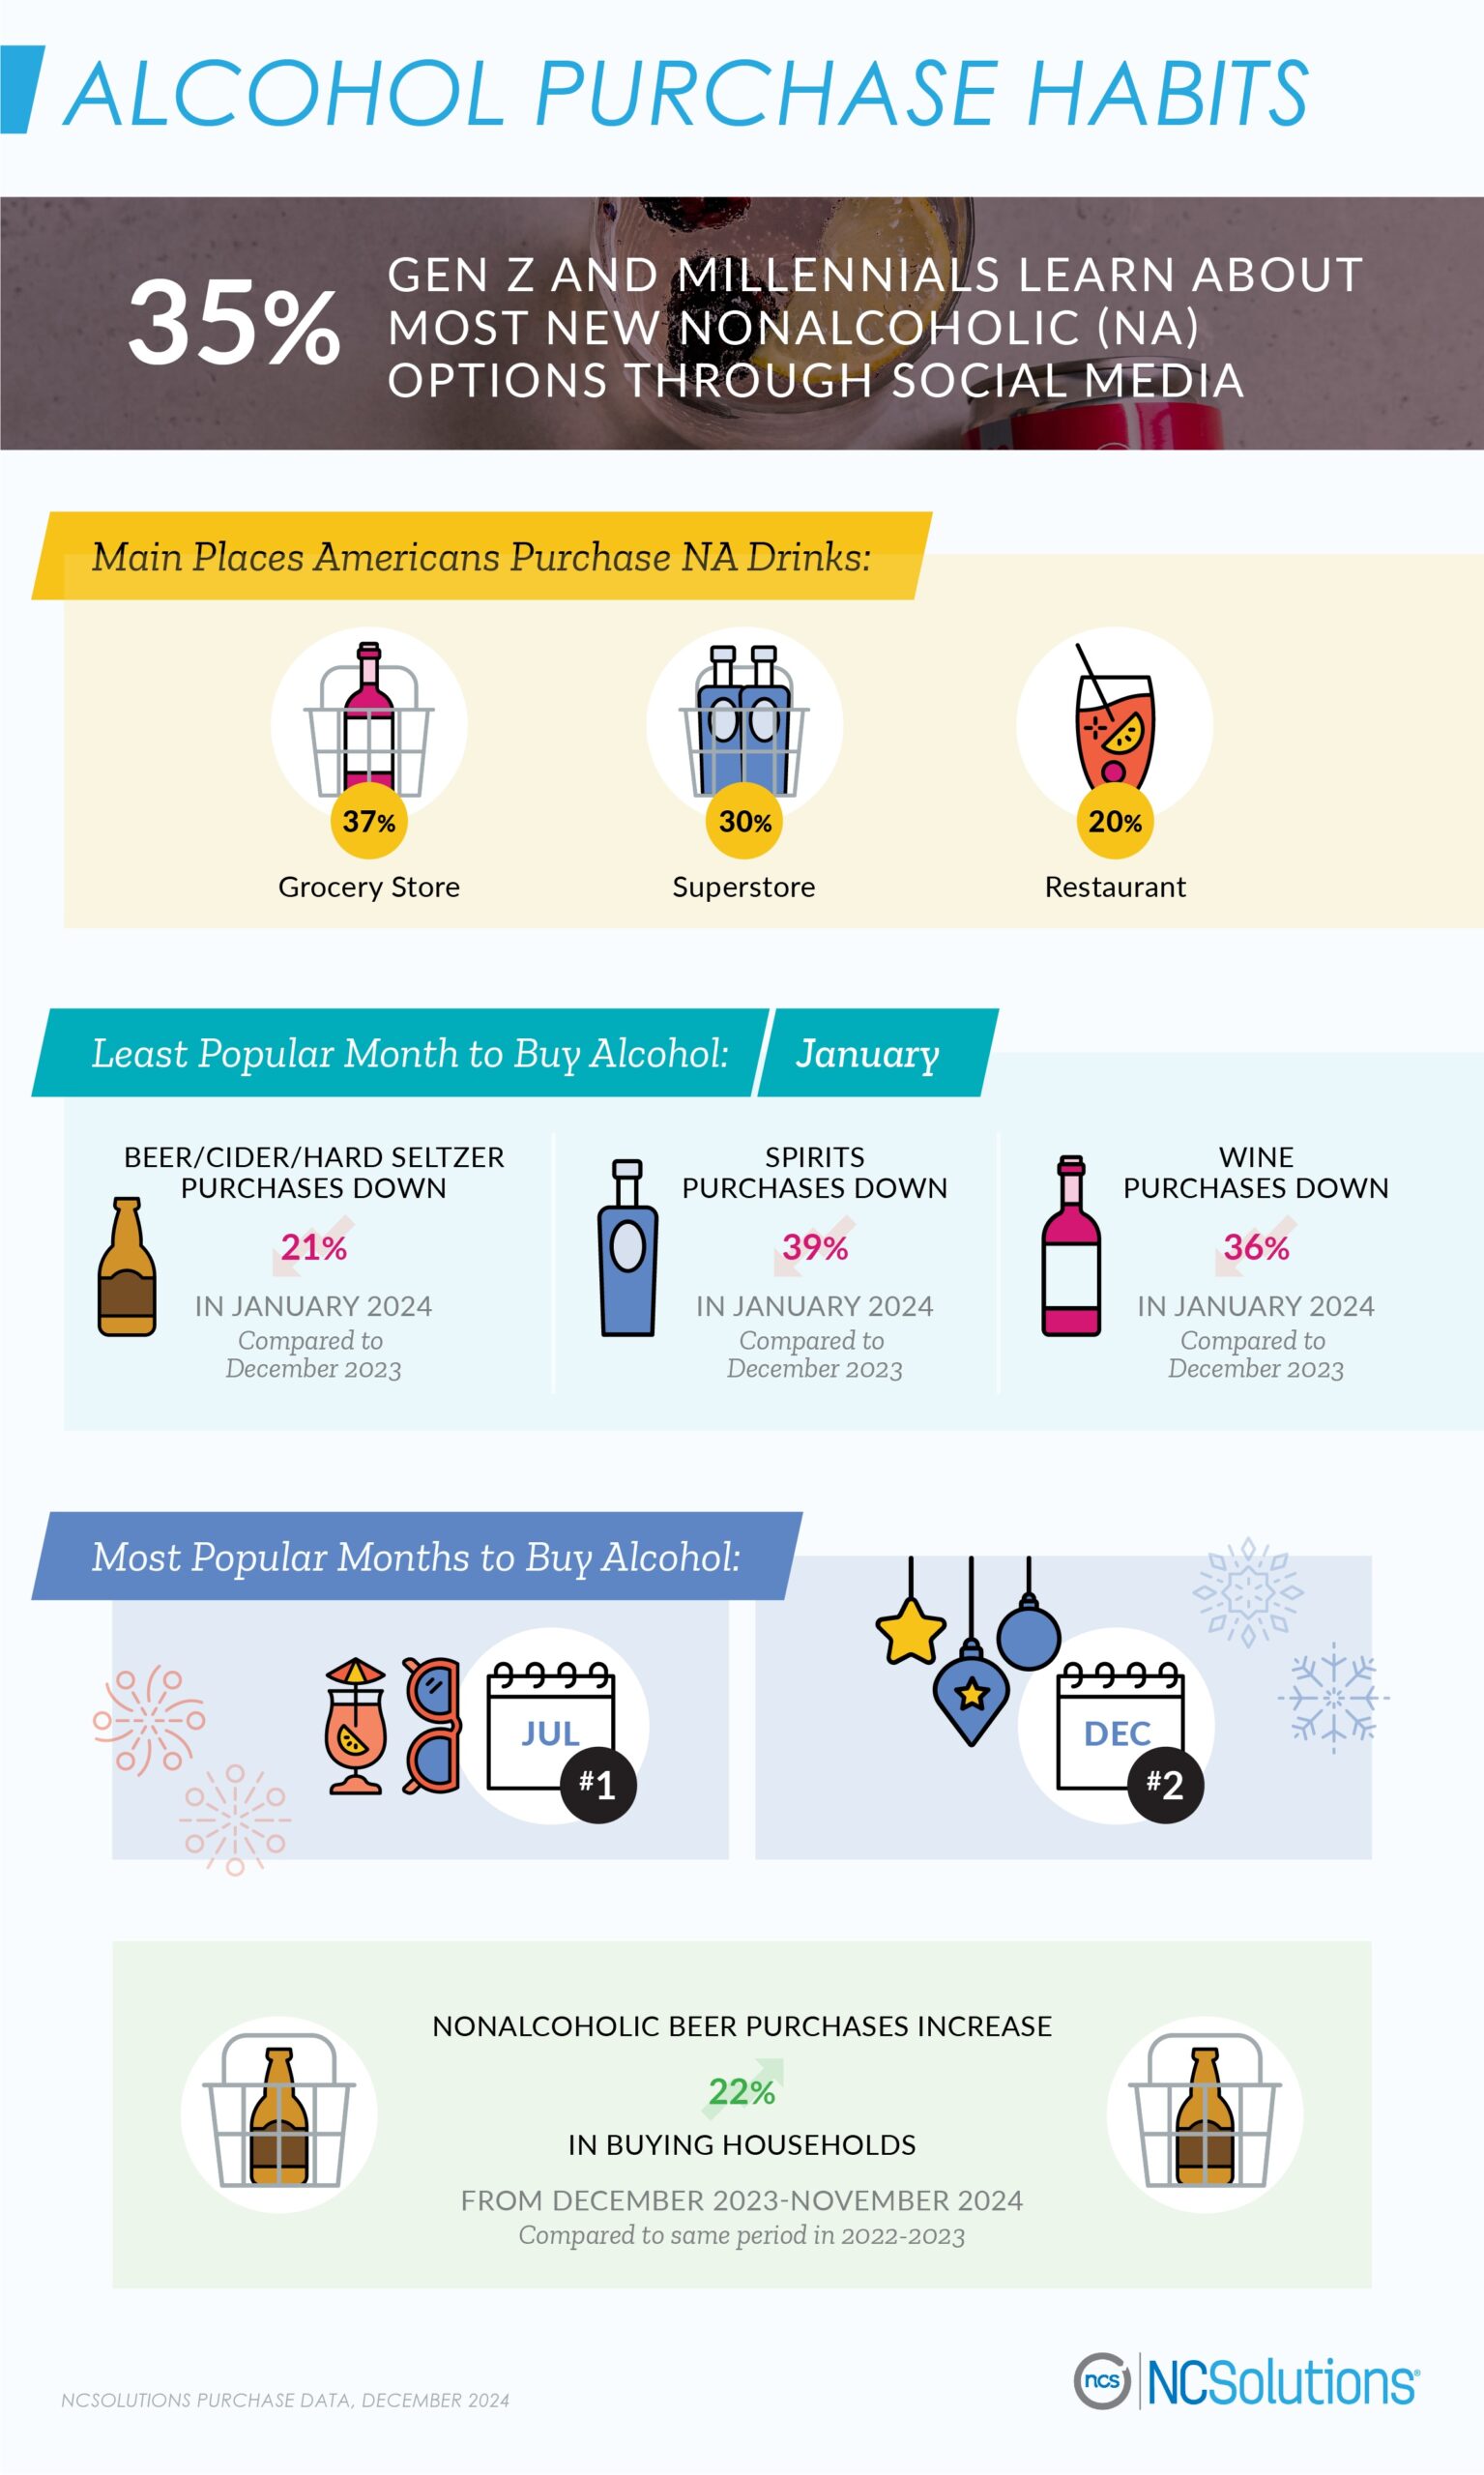
Dry January appears to be having an influential impact on consumer shopping habits. According to NCSolutions purchase data, the least popular month to buy alcohol is January. In January 2024, purchases of spirits dropped 39% compared to the month prior. Wine purchases decreased by 36% and beer/cider/hard seltzer purchases decreased by 21% during the same time period.
Meanwhile, purchases of nonalcoholic drinks are on the rise. NCSolutions purchase data shows a 22% increase in alcoholic-free beer purchases from December 2023 – November 2024 in comparison to a year prior. However, if people are out and about, survey data shows the go-to alcohol-free beverage people order is a soft drink, followed by water, tea or coffee.
Statistics show over one in three Gen Z and millennials say social media is the most effective advertising channel used to inform them about new NA beverages. With more nonalcoholic products becoming available, the competition is fierce to get brand recognition and drum up consumer interest. Stay on top of emerging trends in consumer packaged goods (CPG).
EXPLORE THE GOODS: YOUR HUB FOR CPG INSIGHTS
About the Consumer Sentiment Survey
The consumer sentiment survey of 1,131 Americans was commissioned by NCS in December 2024 and was made up of U.S. adults ages 21+, who were asked about their drinking patterns and preferences. Results were weighted to be representative of the U.S. population by age, gender, region, ethnicity, marital status, education level, and household income.
About the NCS Purchase Data
NCS provides purchase insights to brands to help them target, optimize, measure, and enable sales-based outcomes. NCS’s representative and balanced consumer CPG purchase data set consists of the industry’s preeminent and comprehensive sources. It is inclusive of actual purchase data (transaction information) from big-box retailers, supermarkets, drug stores, convenience stores, and other retail channels at which American households buy CPG products spanning 340+ grocery categories. The NCSolutions purchase data was analyzed in December 2024.
For media inquiries, please contact ncs.press@ncsolutions.com.
Fair Use
When using this data and research, please attribute by linking to this study and citing NCSolutions.
Sober Curious Movement Guide
The sober curious movement is transforming the conversation around drinking habits. It’s not limited to people struggling with addiction, but anyone who’s looking to make a change to their lifestyle. Below are some commonly asked questions about this movement and nonalcoholic drinks.
What does it mean to be sober curious?
Being sober curious means taking an introspective look at yourself and your drinking habits. It’s an intentional method, meant for people to change their lifestyle by no longer drinking at all or drinking more mindfully.
What is the sober curious movement?
Writer Ruby Warrington is believed to have coined the term “sober curious.” In 2018, Warrington published the book “Sober Curious: The Blissful Sleep, Greater Focus, Limitless Presence, and Deep Connection Awaiting Us All on the Other Side of Alcohol.” It encouraged people to ask questions and become more mindful about their drinking habits.
Do nonalcoholic beer, wine, and spirits have any alcohol in them?
Drinks that are labeled nonalcoholic may still contain some minimal alcohol. According to the Alcohol and Tobacco Tax and Trade Bureau, drinks can be labeled and sold as such as long as they have less than .5% alcohol by volume.
Where can you buy nonalcoholic spirits, beer, or wine?
Nonalcoholic spirits, beer, and wine can be purchased at most stores including grocery stores, convenience stores, superstores, wholesale, and some liquor stores. While nonalcoholic beverages are becoming more readily available to purchase, in 2025, 21% of Americans shared one of the biggest challenges they have when it comes to nonalcoholic drinks is the limited availability.
Do you have to be 21 to buy nonalcoholic beer, wine, or spirits?
Legally, the answer to this question varies depending on the state where you live, as well as laws within individual counties and cities. The policy can also vary from store to store.
Can people under 21 drink nonalcoholic beer, wine, or spirits?
Again, there’s no simple answer here. The answer varies based on where people live and the laws within their state, county, or city. Some states have laws allowing people under 21 to drink nonalcoholic beverages with a parent or guardian present.
Can pregnant women drink nonalcoholic beer, wine, or spirits?
Our study found that 39% of women who had given birth within the last three years have had nonalcoholic beer, wine, and spirits while pregnant or nursing. A 2014 study from the College of Family Physicians of Canada does not recommend drinking nonalcoholic or alcohol-free versions of alcoholic drinks for new or expectant mothers. As noted, nonalcoholic drinks can still contain as much as .5% alcohol by volume. The Centers for Disease Control recommends no alcohol use at all when women are pregnant.
Past Alcohol Habits and Alcohol-Free Trends in 2023 & 2024
Sober Curious Statistics
- Sober Curious movement awareness
- 2023: 25% of Americans
- 2024: 25% of Americans
- Believe younger Americans are drinking less than older Americans
-
- 2023: 34% of Americans
- 2024: 39% of Americans
-
- 42% believe Gen Z is spearheading the sober curious trend in 2024
- Reasons for Going Alcohol-Free
- Mental Health
- 36% of Gen Z are going alcohol-free for their mental health in 2024
- Mental Health
- 74% feel younger generations are using cannabis more than older generations in 2023
- 45% are interested in going to a sober bar in 2023
- 39% wish there were more sober bars in their area in 2023
Nonalcoholic (NA) Drinks
- 24% of Gen Z have tried a nonalcoholic beverage because a celebrity or influencer endorsed it in 2024
- 34% of Gen Z are more likely to try a new drink product if it’s marketed to align with the sober curious lifestyle in 2024
- 1 in 4 women who have given birth in the last 3 years had NA beer, wine, or spirits while pregnant or nursing
Drinking Statistics
- Average alcoholic drinks per week
- 2023: 4 alcoholic drinks
- 2024: 3 alcoholic drinks
- Average amount spent monthly on alcohol
- 2024: $105
- Planning to drink less in the next year
-
- 2023: 34% of Americans
- 2024: 41% of Americans
- Feel drinking is a big part of America’s culture
-
- 2023: 93% of Americans
- 2024: 84% of Americans
- Identify as mindful drinkers
- 2023: 26% of Americans
- 2024: 34% of Americans
- Identify as social drinkers
- 2023: 74% of Americans
- 2024: 67% of Americans
- Identify as stress drinkers
-
- 2023: 16% of Americans
- 2024: 16% of Americans
Non-Drinking Statistics
- Did not drink alcohol at all in the past year
- 2023: 24% of Americans
- 2024: 28% of Americans
- 17% of Americans did not drink, but used marijuana in 2023
- Reasons for not drinking
- Just don’t want to drink
- 2023: 56% of Americans
- 2024: 52% of Americans
- For their health
- 2023: 31% of Americans
- 2024: 29% of Americans
- Just don’t want to drink
-
- Fear of becoming addicted to alcohol
- 2023: 20% of Americans
- 2024: 28% of Americans
- Fear of becoming addicted to alcohol
-
- To save money
- 2023: 21% of Americans
- 2024: 21% of Americans
- To save money
-
- To improve their mental health
- 2023: 21% of Americans
- 2024: 20% of Americans
- To improve their mental health
-
- Don’t like the taste of alcohol
- 2023: 32% of Americans
- 2024: 33% of Americans
- Don’t like the taste of alcohol
-
- Felt judged for not drinking
- 2024: 29% of Americans
- Felt judged for not drinking
-
- Asked why they don’t drink
-
-
- 2024: 44% of Americans
-
2023 NCS Purchase Data: Alcohol Purchase Habits
- Most popular times of the year to drink alcohol were the winter holidays and summer months in 2022
- Wine purchases were up 17% from November 2022 to December 2022
- Alcohol purchases were up 8% from November 2022 to December 2022
- Wine purchases dropped by 29% from December 2021 to January 2022
- Alcohol purchases dropped by 19% from December 2021 to January 2022
2024 NCS Purchase Data: Alcohol Purchase Habits
- Most popular months to buy alcohol in 2023 were March, May, and December
- Least popular month to buy alcohol in 2023 was January
- Most popular alcohol purchases in 2023 was wine, spirits, and beer/cider/seltzer
- Alcohol purchases dropped by 24% from December 2022 to January 2023
About the Consumer Sentiment Surveys
2024 data:
The consumer sentiment survey of 1,062 Americans was commissioned by NCS in December 2023 and was made up of U.S. adults ages 21+, who were asked about their drinking habits and preferences. Results were weighted to be representative of the U.S. population by age, gender, region, ethnicity, marital status, education level, and household income.
2023 data:
In January 2023, we commissioned a consumer sentiment survey of 1,082 Americans about their drinking habits and preferences. Twenty-five percent were Baby Boomers, 25% Gen X, 25% millennials, and 25% Gen Z. Forty-nine percent were male, 48% female, 1% non-binary/non-conforming, 1% transgender, and 1% preferred not to respond. Respondents ranged in age from 21 to 78, with an average age of 43.
About the NCS Purchase Data
The NCSolutions purchase data was analyzed in January 2023 and January 2024 respectively.