
Caffeine Culture: America’s Love and Reliance on Caffeinated Beverages
Caffeine Culture: 1 in 4 Americans Can’t Go a Day Without Caffeine
“I love coffee. I love tea. I love the java jive and it loves me.” You may not have heard of the song Java Jive, but many Americans agree with its lyrics. Caffeine is a must-have, with 97% of Americans drinking caffeinated beverages such as coffee, tea, or soda at some point in their lives.
Our new consumer sentiment survey discovers which caffeinated drinks people are most drawn to, and how much people rely on having these energy-boosting beverages to make it through the day.
Top Reasons People Drink Caffeine
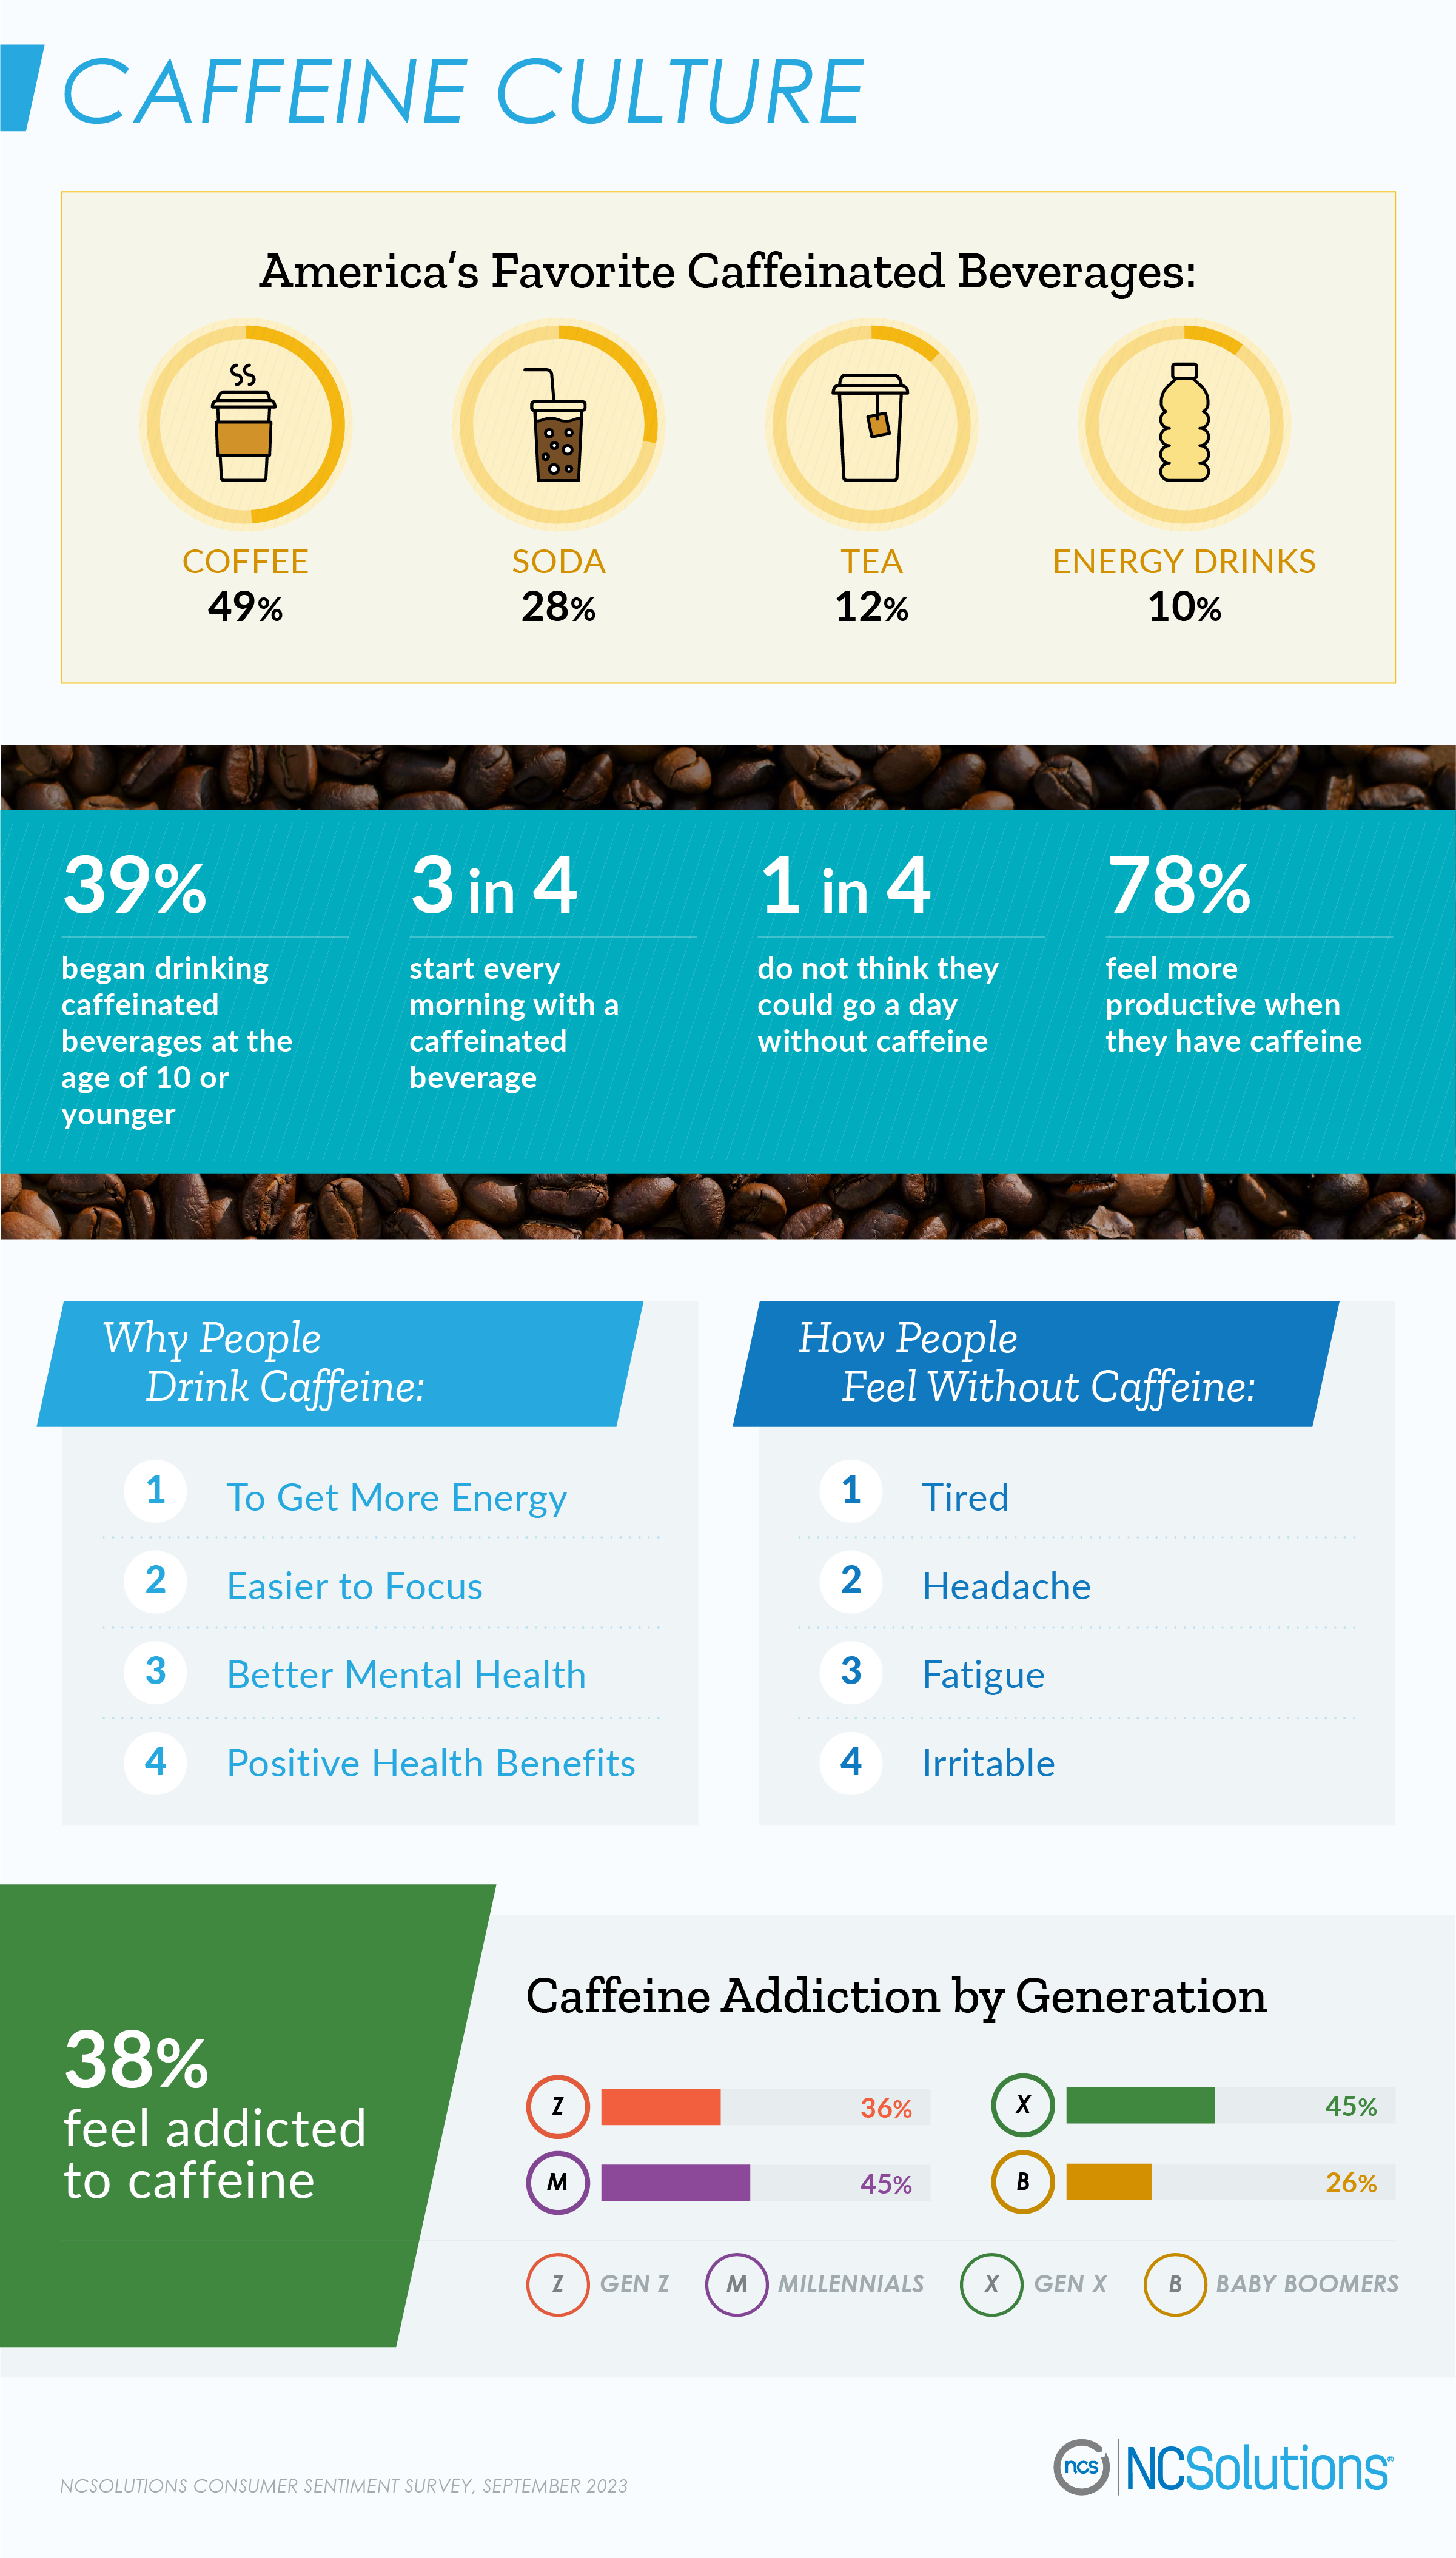
The go-to caffeinated beverage for Americans is coffee. More than half say a cup of joe is their favorite caffeinated drink followed by soda and tea. Only one in 10 turns to energy drinks, and these types of drinks draw more men than women. They’re also favored by younger consumers. More than two in five Gen Zers drink energy drinks compared to just 13% of Millennials, 7% of Gen Xers, and 3% of Baby Boomers.
For some, caffeine culture starts young. Nearly two in five began drinking caffeinated beverages at the age of 10 or younger. However, most weren’t introduced to coffee until later in life. More than two in five shared they started drinking coffee at age 18 or older.
People mainly drink caffeine to get more energy or to help with their focus. Others do it for their mental health or for the positive health benefits. About four in five feel more productive after they’ve consumed caffeine.
For many, skipping the daily caffeine ritual is not easy. Without it, people report feeling tired, getting headaches, or battling fatigue. Nearly two in five feel addicted to caffeine. Generationally, Millennials and Gen X are the most addicted followed by Gen Z.
How Caffeine Affects Americans
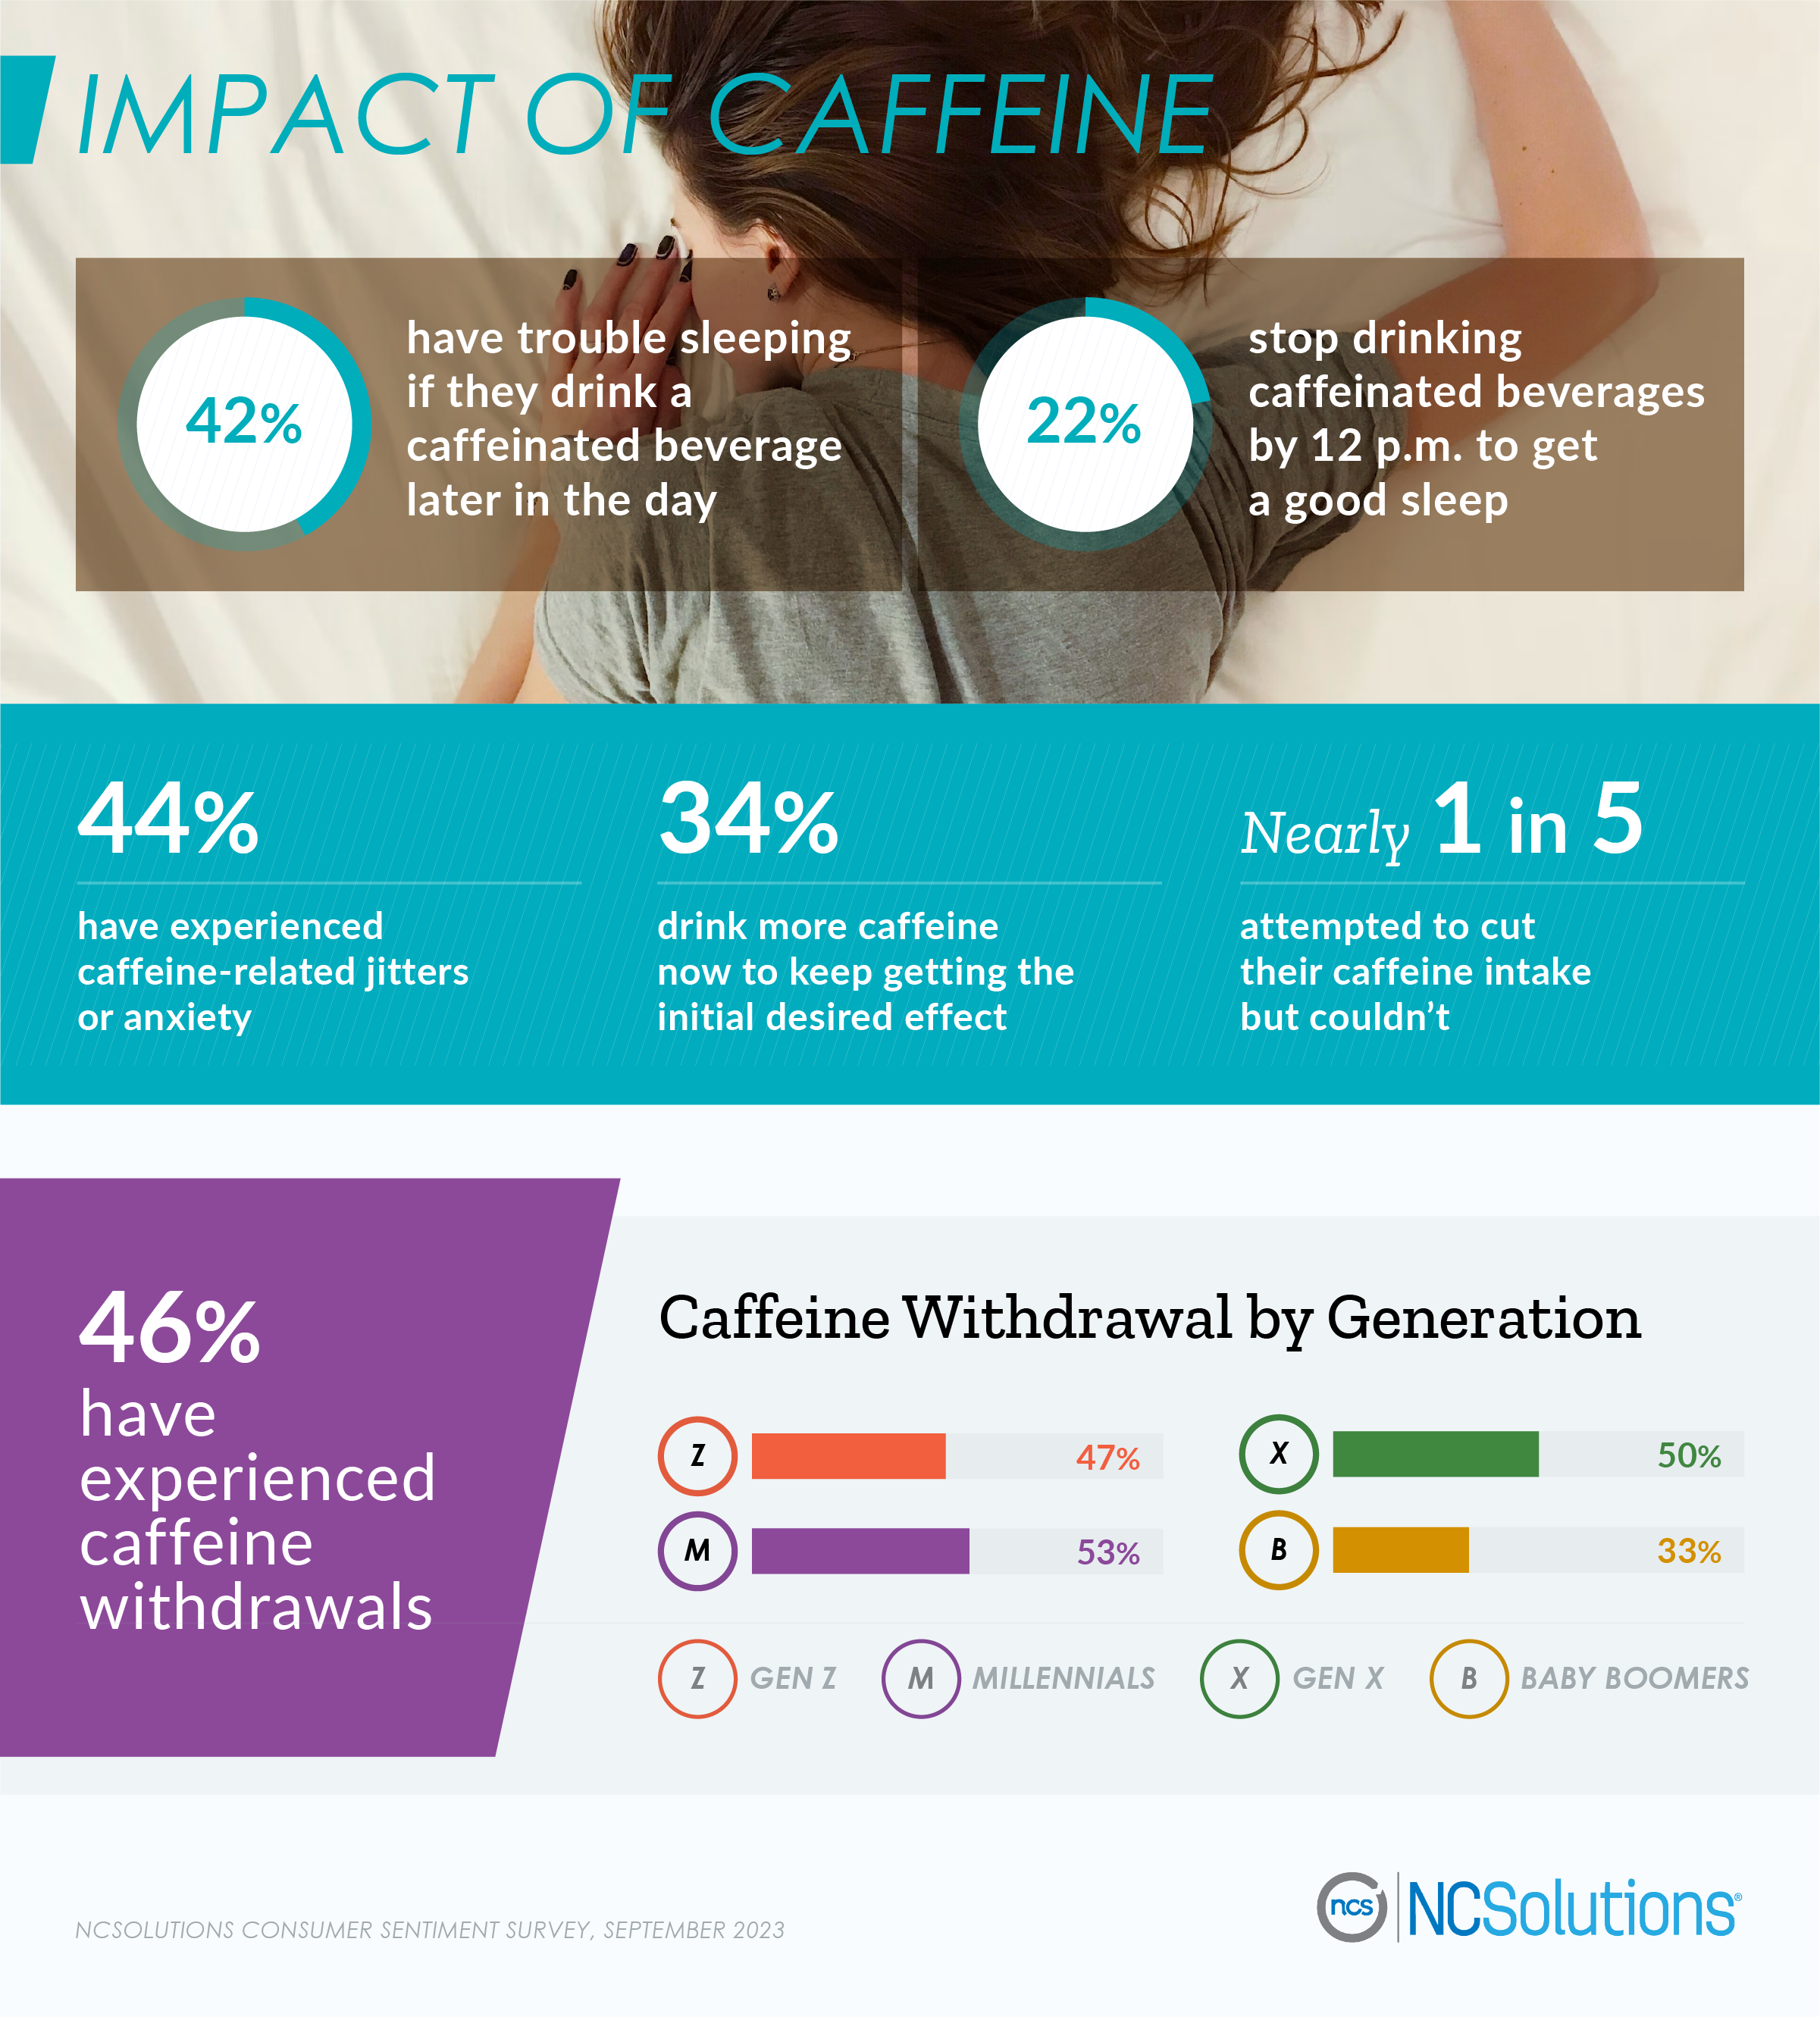
While some people feel less draggy with caffeine, 42% of Americans say it’s a problem when they drink it too late in the day. More than one in five consumers must stop drinking caffeine by noon or earlier to ensure they can sleep through the night.
More than one in three Americans have to drink more caffeine now compared to when they first started drinking it to get the initial desired effect. In the meantime, some are trying to cut caffeine out of their lives. Nearly one in five consumers admitted to trying to give up caffeine, but they couldn’t do it.
Nearly half of Americans have experienced some form of caffeine withdrawal when going without it. Those experiencing it the most are Millennials followed closely by Gen Xers and Gen Zers. Baby Boomers don’t seem to deal with it as much, with exactly one in three reporting negative effects.
Caffeine Drinking Decisions and Coffee Shop Purchases
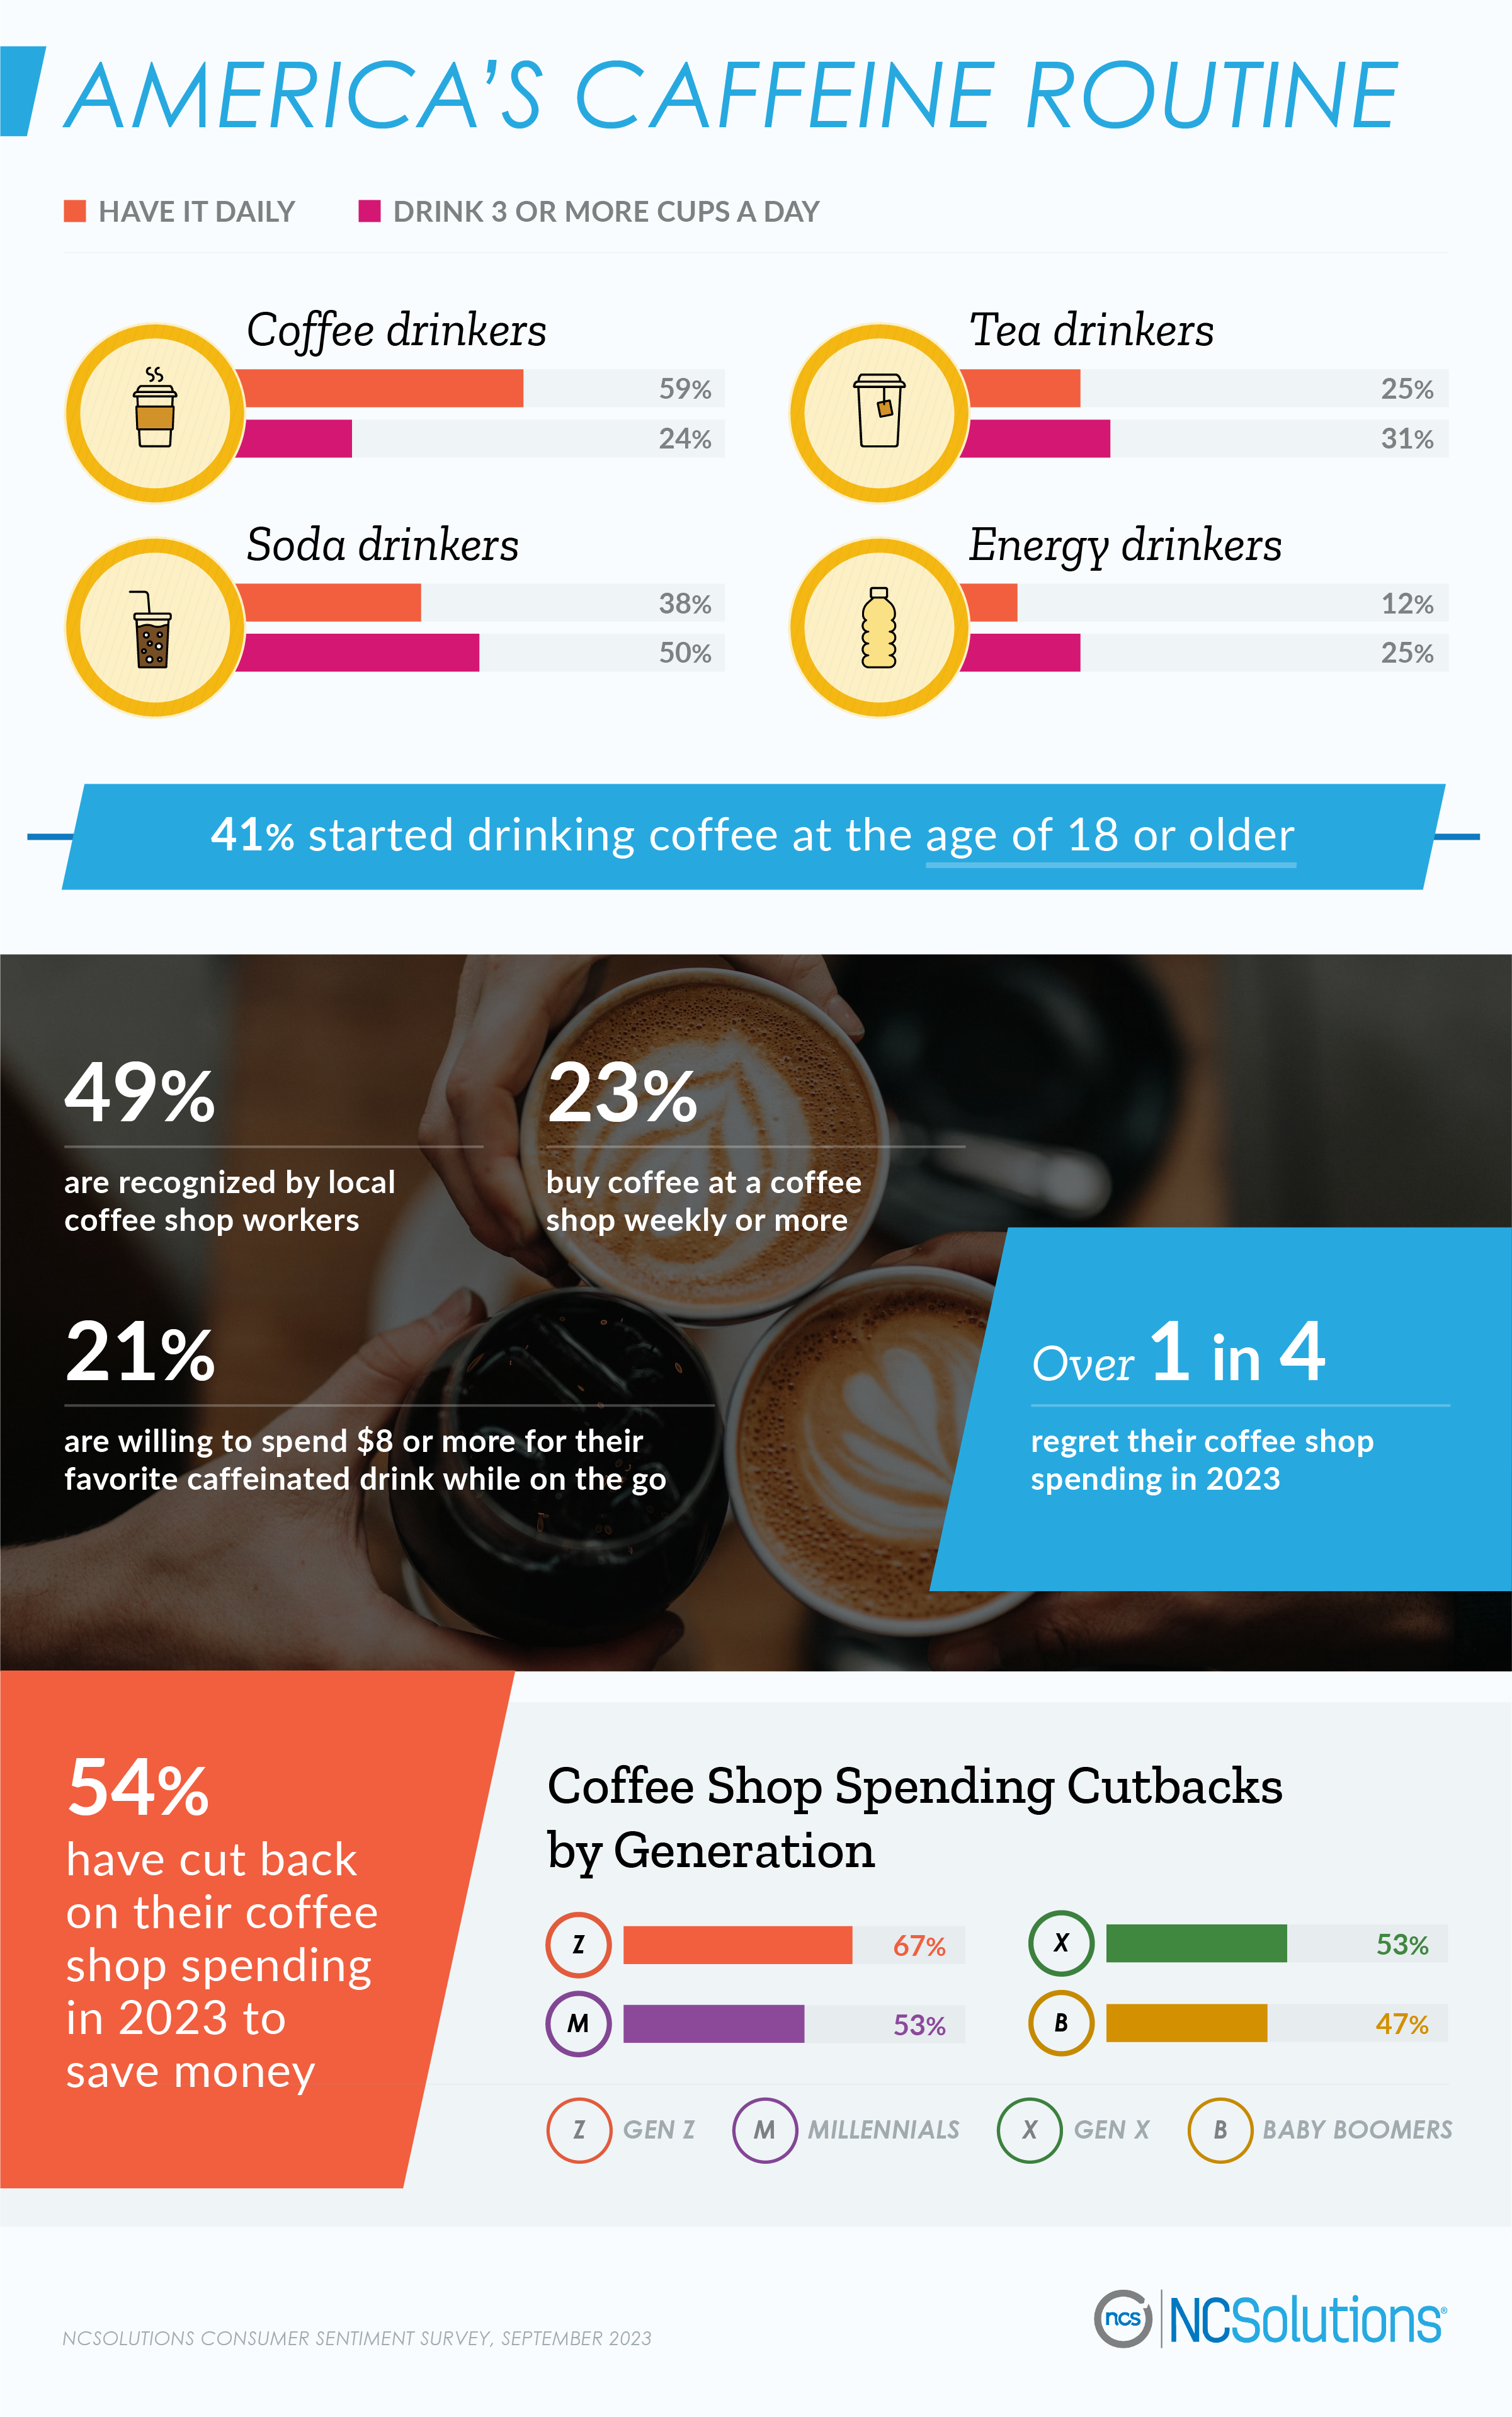
Of those who drink coffee, 59% drink it daily, and many opt for a lot more than just one cup. Nearly one in four drink three cups or more a day. Meanwhile, 38% of soda drinkers pop open a can daily, and half of soda drinkers guzzle down three cans or more every day. As for tea drinkers, one in four drink it daily.
While people make caffeinated drinks at home, many choose to buy them while on the go. Nearly one in four purchase coffee at a coffee shop weekly or more, and people are willing to pay for their favorite drink. More than one in five would spend $8 or more on their favorite caffeinated beverage.
Of course, treating yourself while out and about does add up, and over one in four regrets their coffee shop spending. In fact, more than half have cut back on their coffee shop spending in 2023 to save money. The biggest generation to do so: Gen Z.
Caffeine Purchase Decisions
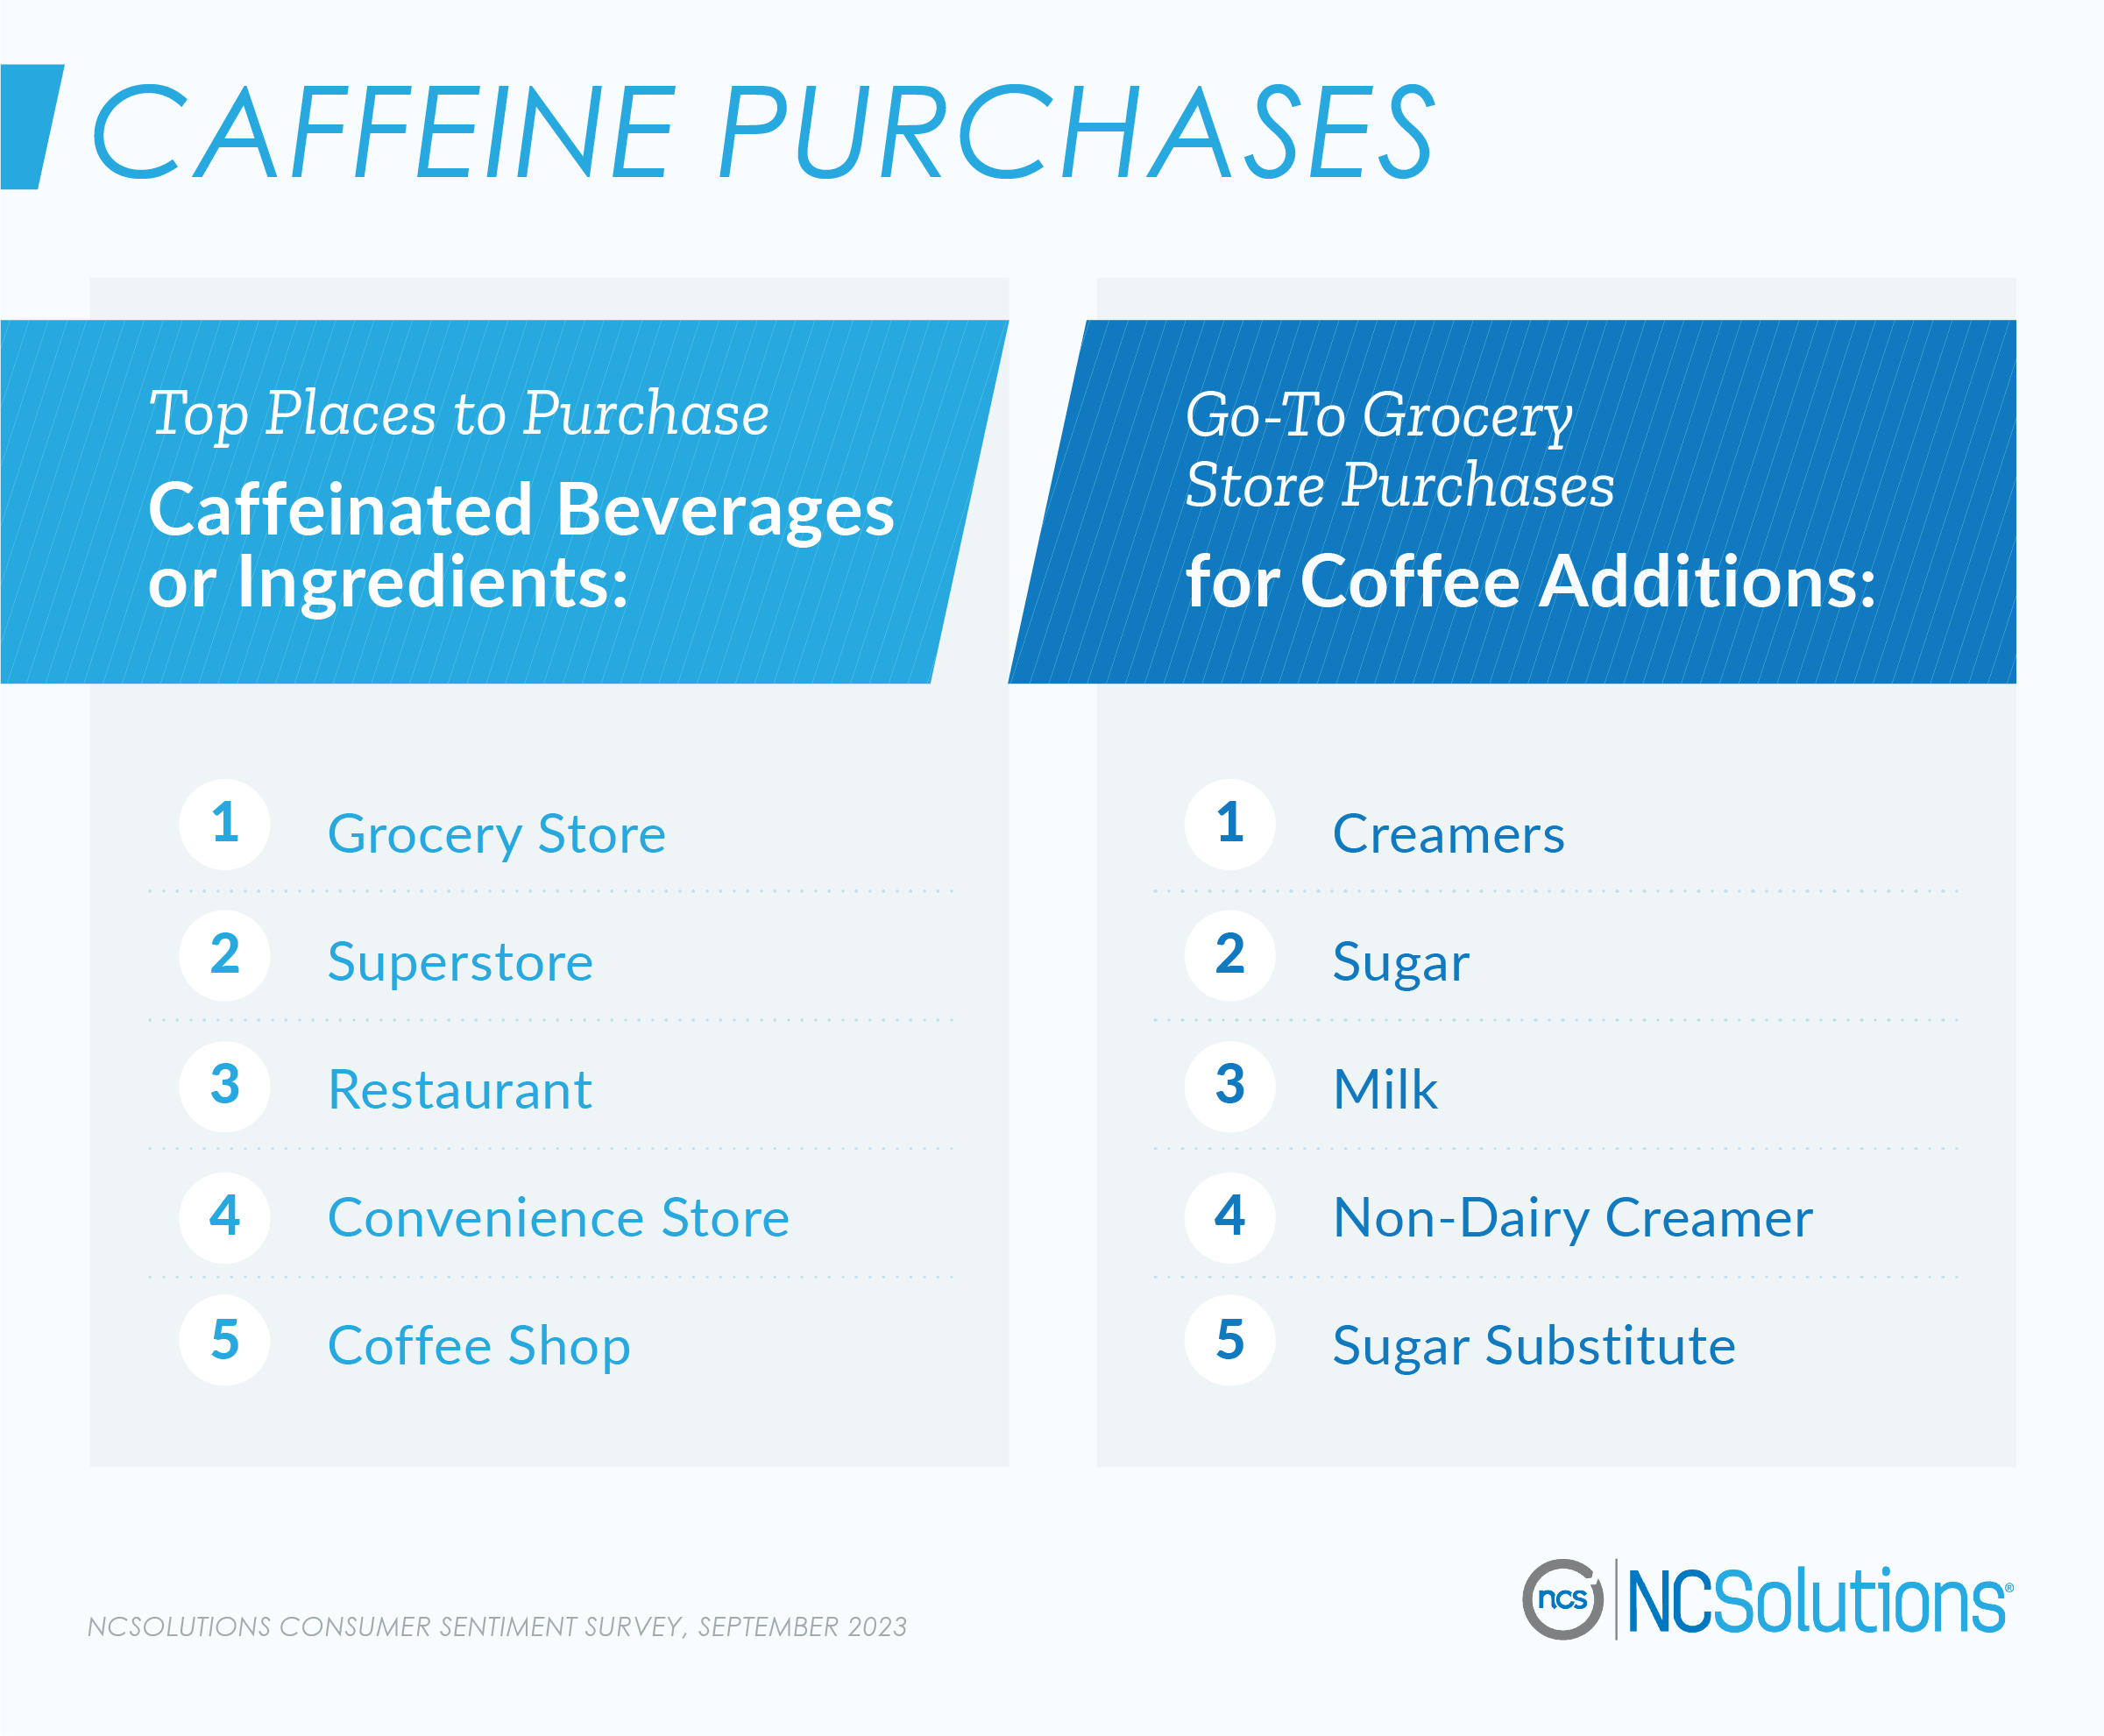
When buying caffeinated beverages or the ingredients to make them, the first stop for most people is the grocery store. Others go to superstores or restaurants along with convenience stores. A little less than half pick up what they need at a coffee shop.
While some coffee drinkers drink it black, others like to spice up their coffee with some additions. Their main go-to is creamers followed by sugar, milk, and non-dairy creamers.
According to NCSolutions purchase insights, the main additives people spent money on from September 2022 to August 2023 are liquid coffee creamers, half-and-half, and specialty beverage syrups. As for coffee products, people mainly purchased packaged coffee such as grounds and beans, followed by ready-to-drink coffee, and espresso. When it comes to tea, the go-to purchases are:
- Liquid (such as iced tea)
- Black
- Green
- Herbal
Interestingly, people are buying more ready-to-drink tea than coffee. Our purchase data found 59% are buying liquid tea compared to 41% who purchase ready-to-drink coffee such as bottled frappuccinos.
For many Americans, caffeine is key to starting the day off right. It’s more than just a drink, but a way of life. Caffeine culture has turned the joy of trying a unique coffee or tea into an experience beyond just an energy boost.
Understanding how and when Americans prefer to purchase and consume caffeine can help beverage brands and retailers have more meaningful engagements with buyers to build brand loyalty. Discover the key factors and best practices that will drive incremental sales for your brand. Download our latest update on the Five Keys to Advertising Effectiveness.
About the Consumer Sentiment Survey
In September 2023, 1,184 U.S. adults ages 18 and older were surveyed about their caffeine preferences and routines. Fifty-one percent were women and 49% were men. Ages ranged from 18-34 (31%), to 35-44 (17%), to 45-54 (18%), to 55-64 (17%), and 65+ (16%). The credibility interval for questions answered by all respondents is plus or minus 4 percentage points.
About the NCS Purchase Data
NCS provides purchase insights to brands to help them target, optimize, measure, and enable sales-based outcomes.NCS’s representative and balanced consumer CPG purchase data set consists of the industry’s preeminent and comprehensive sources. It is inclusive of actual purchase data (transaction information) from big-box retailers, supermarkets, drug stores, convenience stores and other retail channels at which American households buy CPG products spanning 340+ grocery categories. The NCSolutions purchase data was analyzed in October 2023.
For media inquiries, please contact ncs.press@ncsolutions.com.
Fair Use
When using this data and research, please attribute by linking to this study and citing NCSolutions.