
The Spirits of the Season: Holiday Beverages
There’s something absolutely magical about holiday drinks. The festive colors, the cozy warmth they spread as you sip, and Oh! those zesty and sweet flavors. It’s like happiness bottled up in a glass, ready to be poured out and shared.
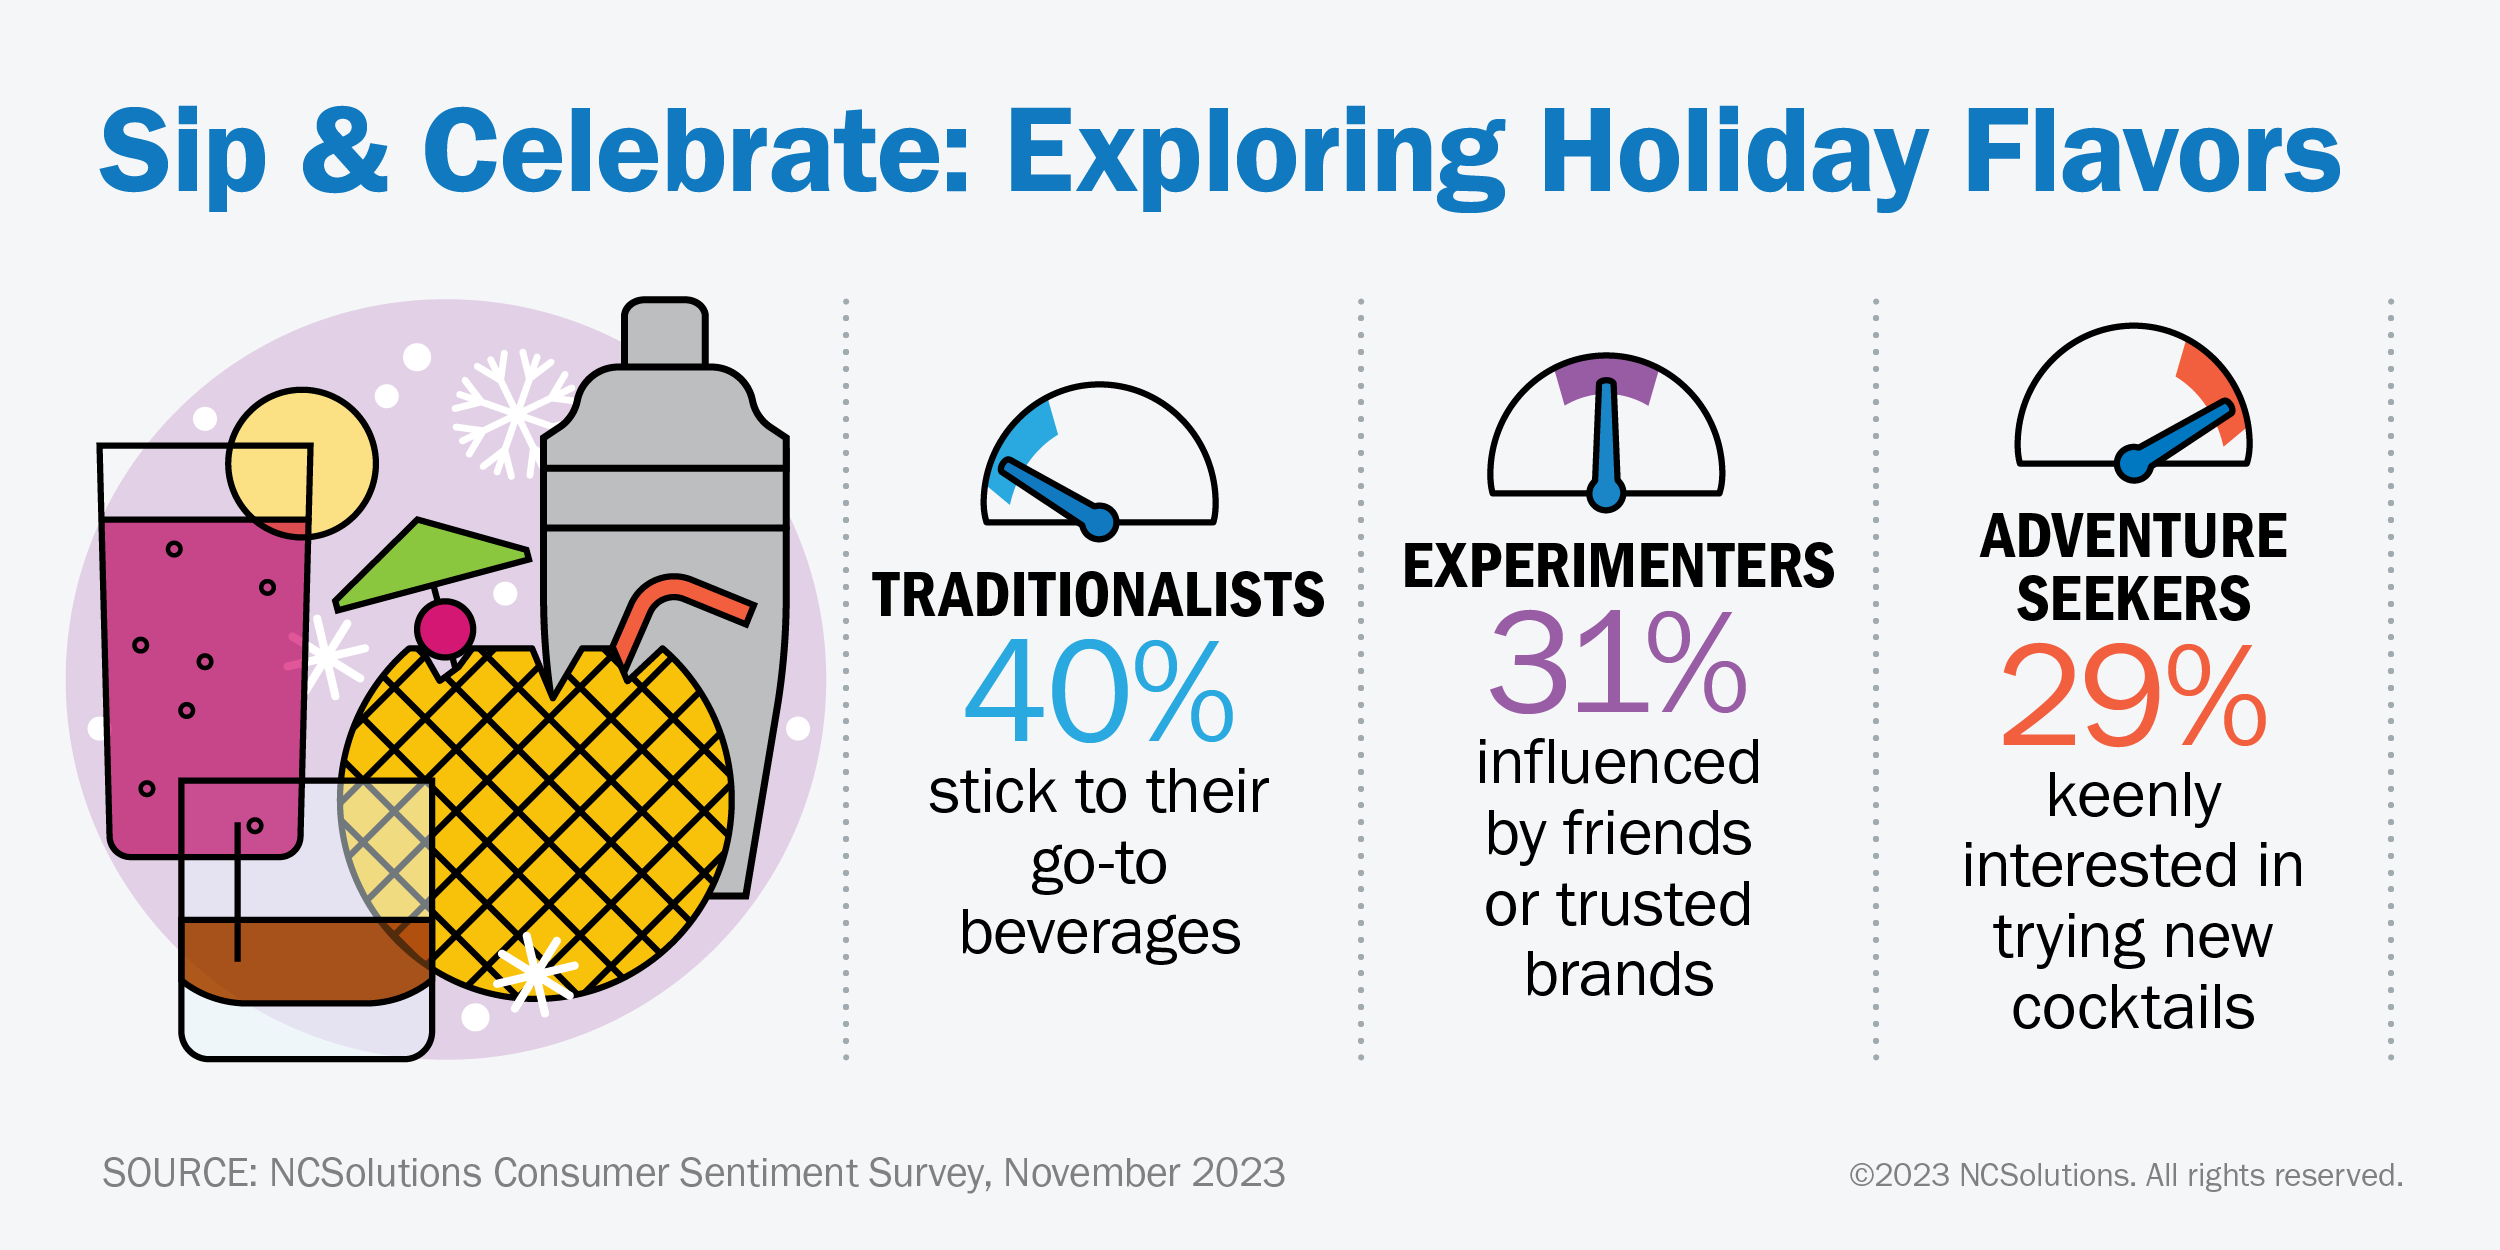
Perhaps it’s the euphoria of being in the company of those we love, but most Americans are a bit adventurous around this time – especially when it comes to beverages. Twenty-nine percent of consumers say they actively seek out new holiday-themed drinks, and nearly one-third (31%) are more likely to experiment when beverages are recommended by a friend or a trusted brand.
Younger drinkers are more likely to be on the hunt for new beverages: 39% of Millennials and 34% of Zoomers say they are eager to try new holiday-themed beverages. Only 12% of baby boomers and 27% of Gen Xers are as bold. Baby boomers, for instance, seem content with their tried-and-true favorites. More than half (52%) say they rarely try new ones during the holidays.
So with the holiday season fast approaching, we wondered which beverages American consumers were buying. While some drinks will always be heavily associated with winter holiday celebrations (eggnog, anyone?), we wanted to see what the actual purchase data said.
America’s Favorite Festive Spirits
Vodka is the most-purchased spirit over the holiday season. It seems we’re not alone in having visions of spiked punch, peppermint vodka martinis and cranberry cocktails dancing in our heads.
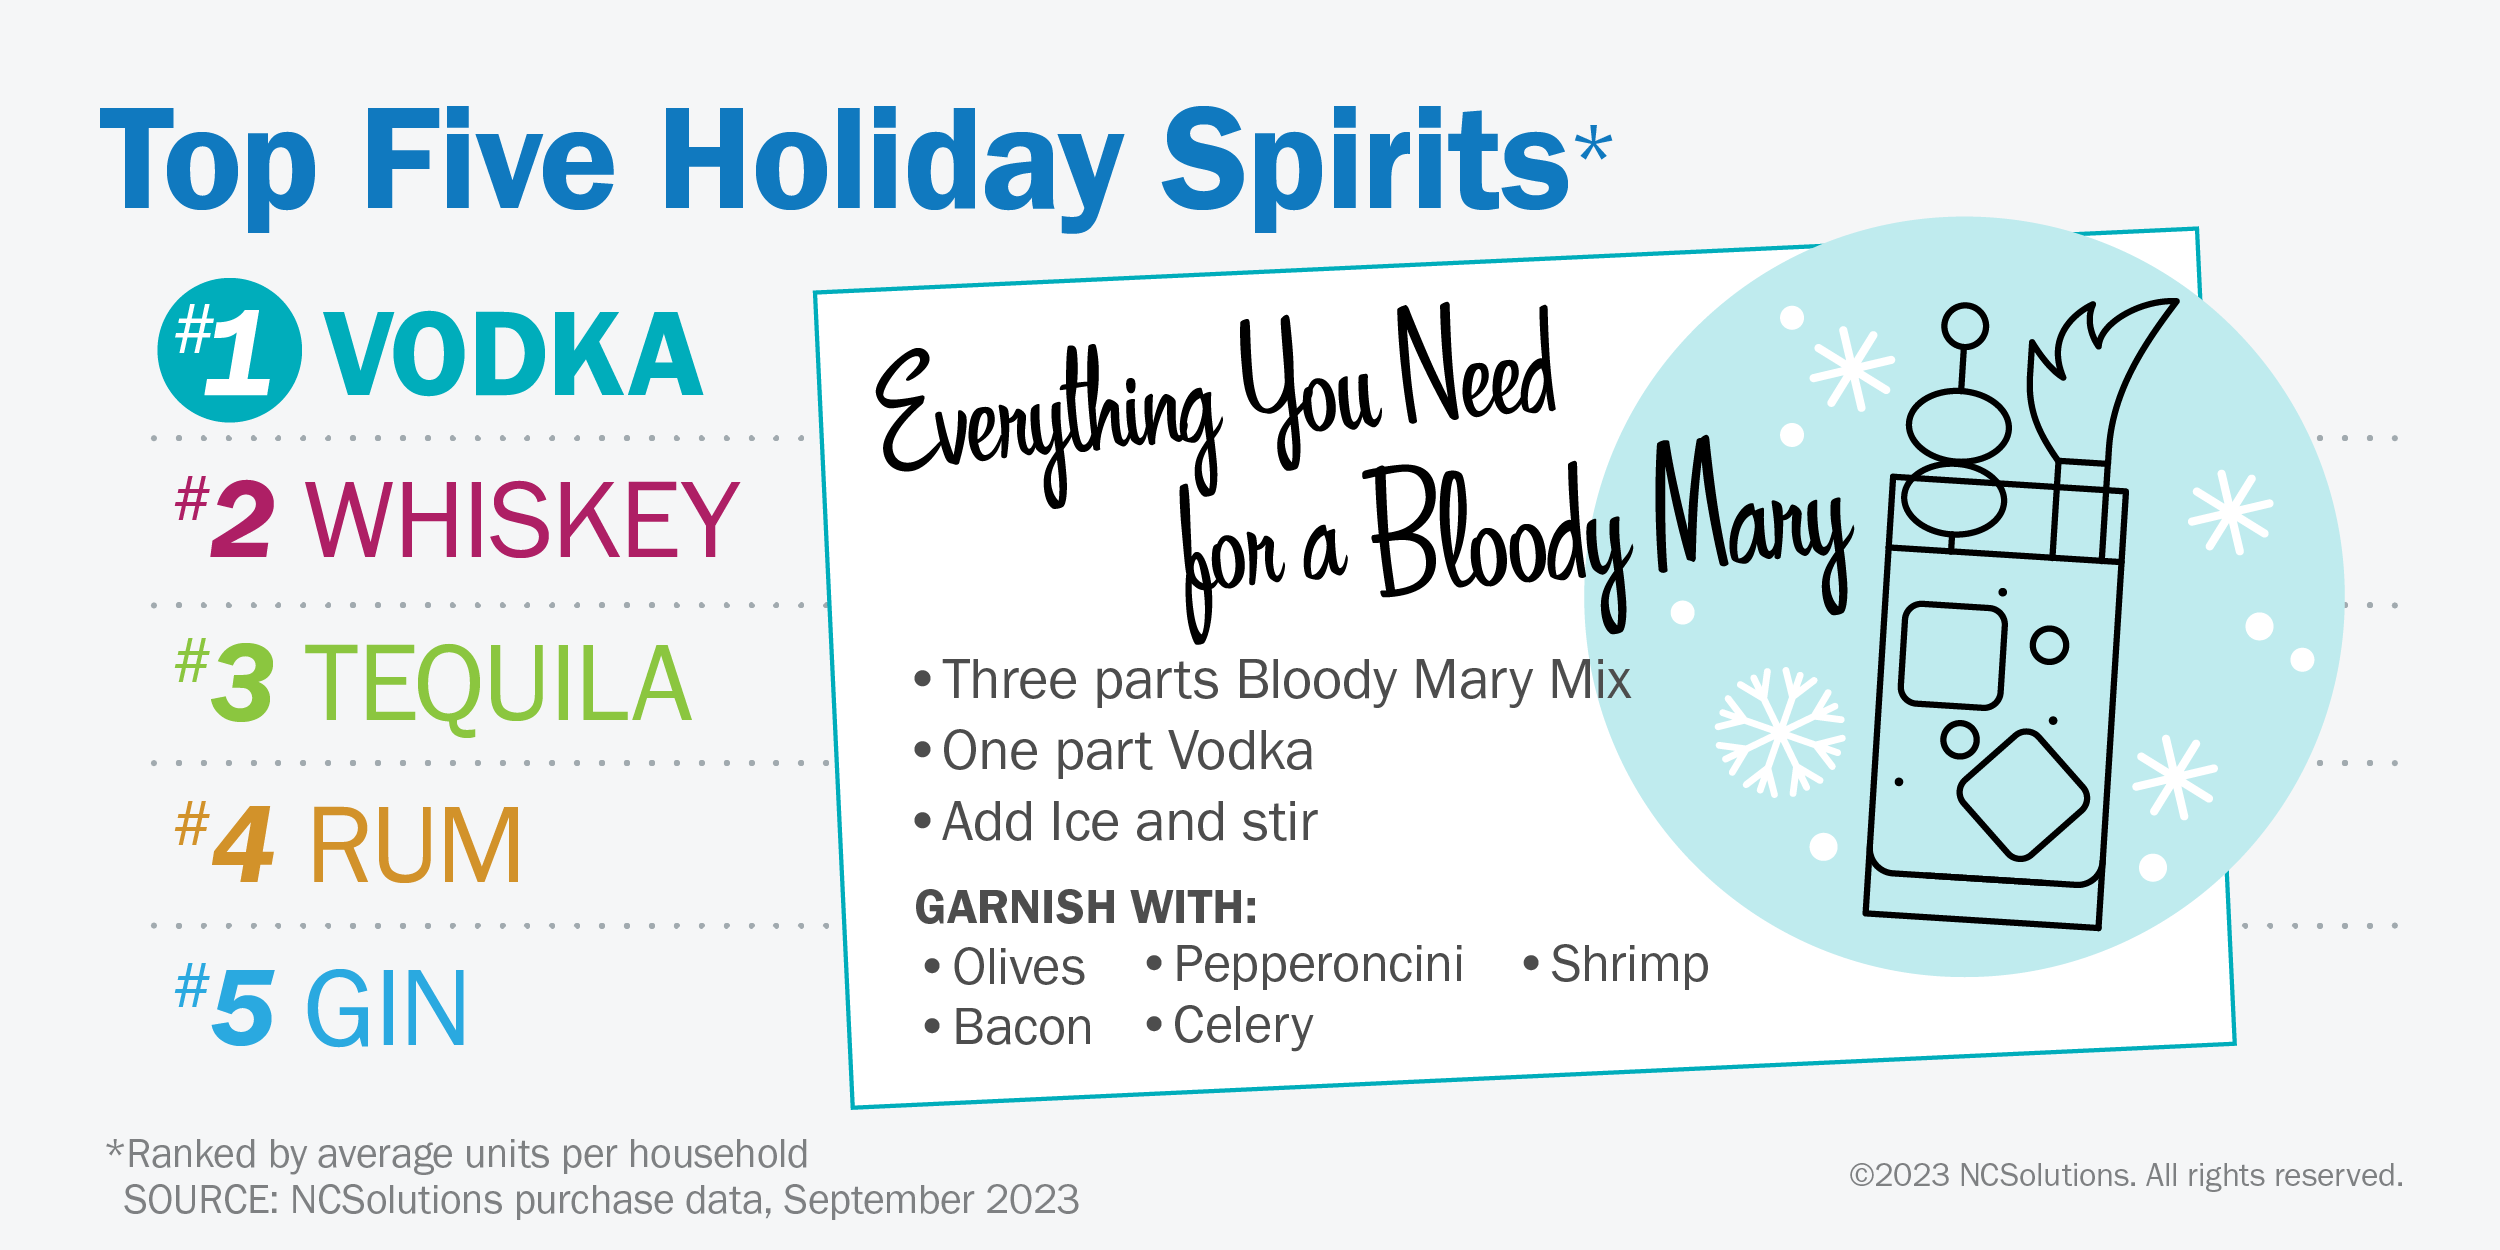
Traditional eggnog can be made with whiskey, rum or a combination of both, so of course, they appear at #2 and #4, respectively, on our list.
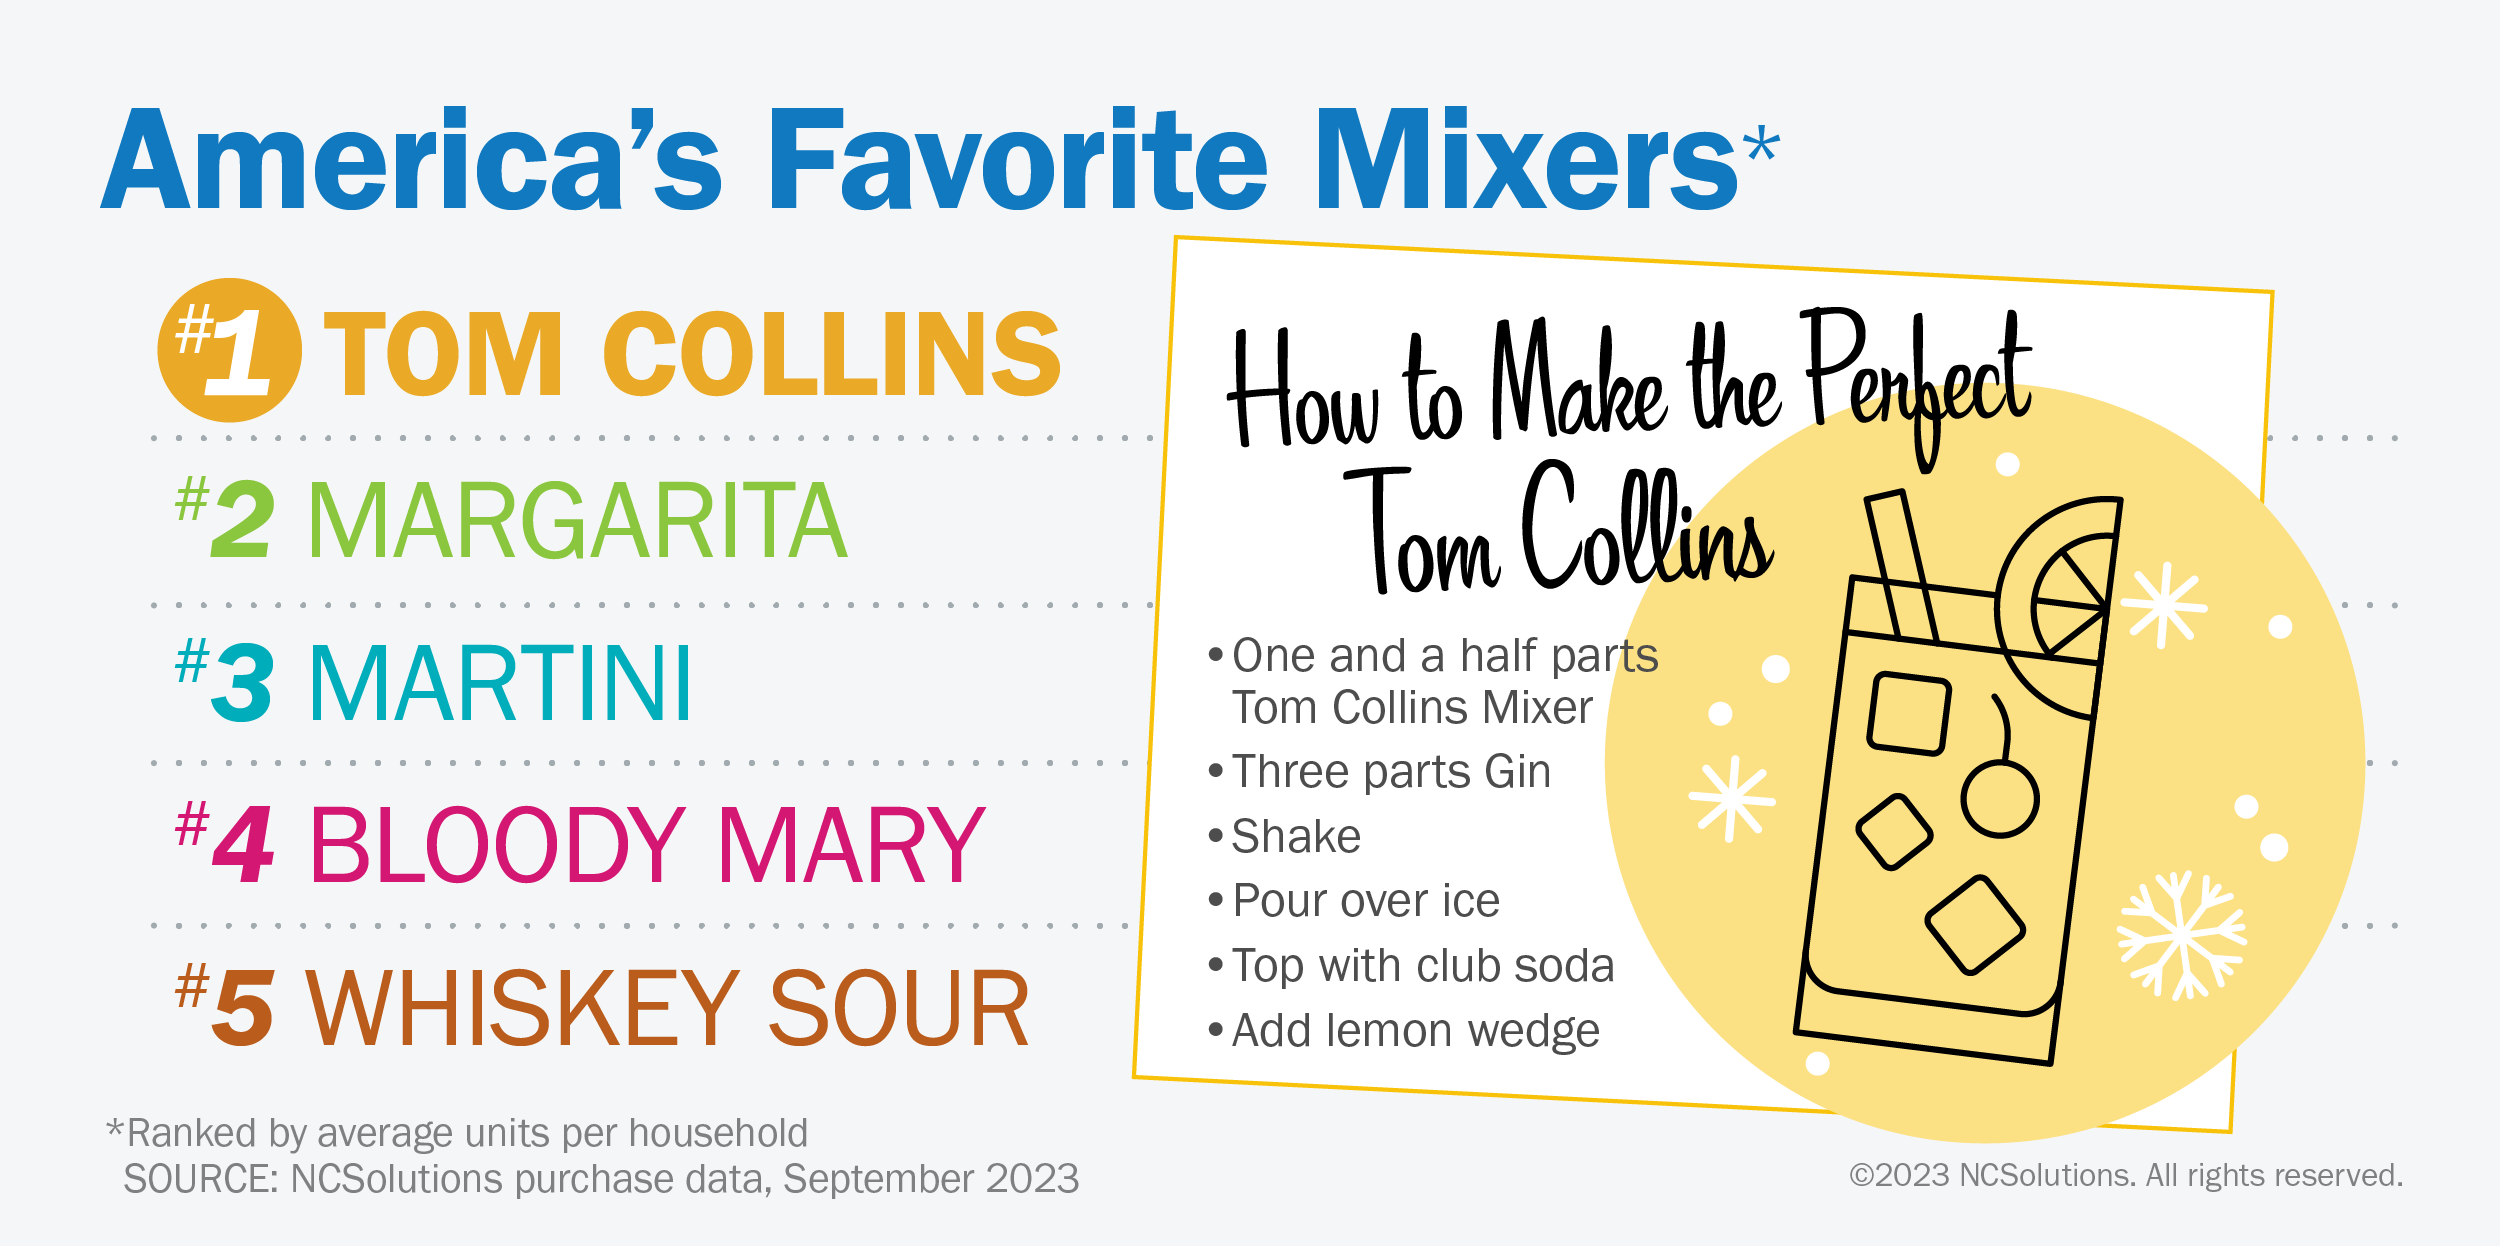
In the mixer category, we have a surprise. The Tom Collins cocktail is typically thought of as a summer drink, but the mixer holds the number one spot over the holidays. In fact, this mixer always comes out on top, regardless of time of year.
Speaking of time of year: Fall is the apple harvest, so we’re not surprised to see apple cider purchase data spike during the season. The number of households purchasing cider from September through December was nearly three times higher than the number that purchased from January through August.
What is a surprise? Although we often associate club soda as a cocktail mixer, July is the most popular month for purchasing this beverage staple. Even so, December comes in second.
Non-alcoholic Drinks Spice Up the Holiday Too
Not everyone wants – or can – imbibe on alcoholic drinks. (Cheers to all the sober curious!) December is the most popular month to buy soft drinks. Our purchase data shows that on average, American households bought 10% more units of soft drinks in December – the most popular month for this item – than they did in February, the least popular month.
We expected household purchases of seltzer water and sparkling water to spike in December, given their presence in consumer pantries. Turns out they’re not on the shopping list for the month. Instead, July is the biggest month for both. On average, households spent 4% more on seltzer in July than in December. In total, US households bought 28% more units of sparkling water in July and August compared to November and December.
Whether it’s infused with spirits or spirit-free, consumers love their holiday drinks. It’s like being wrapped up in a cozy blanket of festive vibes. CPG beverage brands can use these sparkling purchase data insights to plan their seasonal promotions – and sprinkle a little extra joy on everyone’s celebrations.
Cheers to that! ! 🍸🍾❄️☃️
Looking for more info? Head over to The Goods for more CPG insights.
About the Consumer Sentiment Survey
The online survey of 1,016 respondents, age 18 or older, was fielded from November 3-6, 2023. Responses presented in this survey were weighted by location, education, income and other demographics to be representative of the overall population.
About the NCS Purchase Data
NCS provides purchase insights to brands to help them target, optimize, measure, and enable sales-based outcomes.NCS’s representative and balanced consumer CPG purchase data set consists of the industry’s preeminent and comprehensive sources. It is inclusive of actual purchase data (transaction information) from big-box retailers, supermarkets, drug stores, convenience stores and other retail channels at which American households buy CPG products spanning 340+ grocery categories. The NCSolutions purchase data was analyzed in September 2023.
Fair Use
When using this data and research, please attribute by linking to this study and citing NCSolutions.